
The uncomfortable truth: your traffic graphs don’t map to your bill
The migration took six weeks. Three of them were spent undoing a decision made in the first hour.
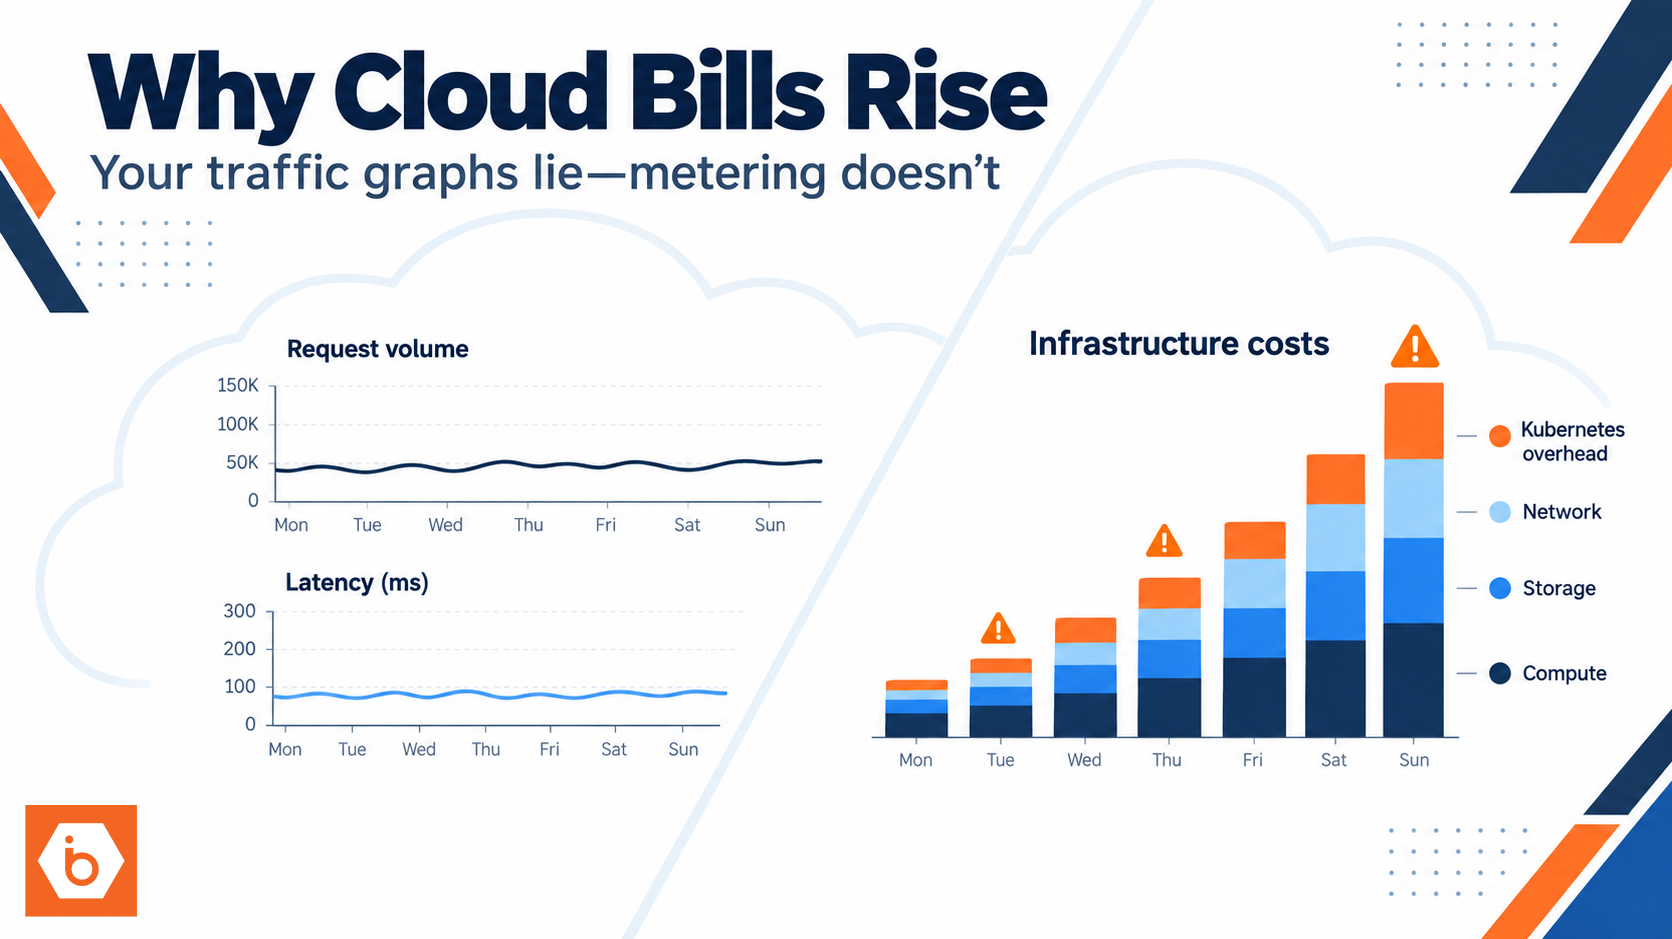
That’s how these cost mysteries usually start. Your app looks fine. RPS stays flat. Latency doesn’t spike. Error rates don’t scream. Then your cloud bill climbs anyway, usually in a way that makes your team doubt their own monitoring.
Most teams get this wrong by staring at “requests” as if it is the billing unit. It isn’t. Clouds meter usage across multiple dimensions: time, provisioned capacity, storage size, network transfer, background jobs, and operational churn. Your application can keep accepting the same number of users while the infrastructure does more work per request, holds more idle capacity, ships more bytes, or runs extra background tasks.
So the real question is not “why did traffic change?” It’s “which meter moved, and why did it move even though user demand didn’t?”
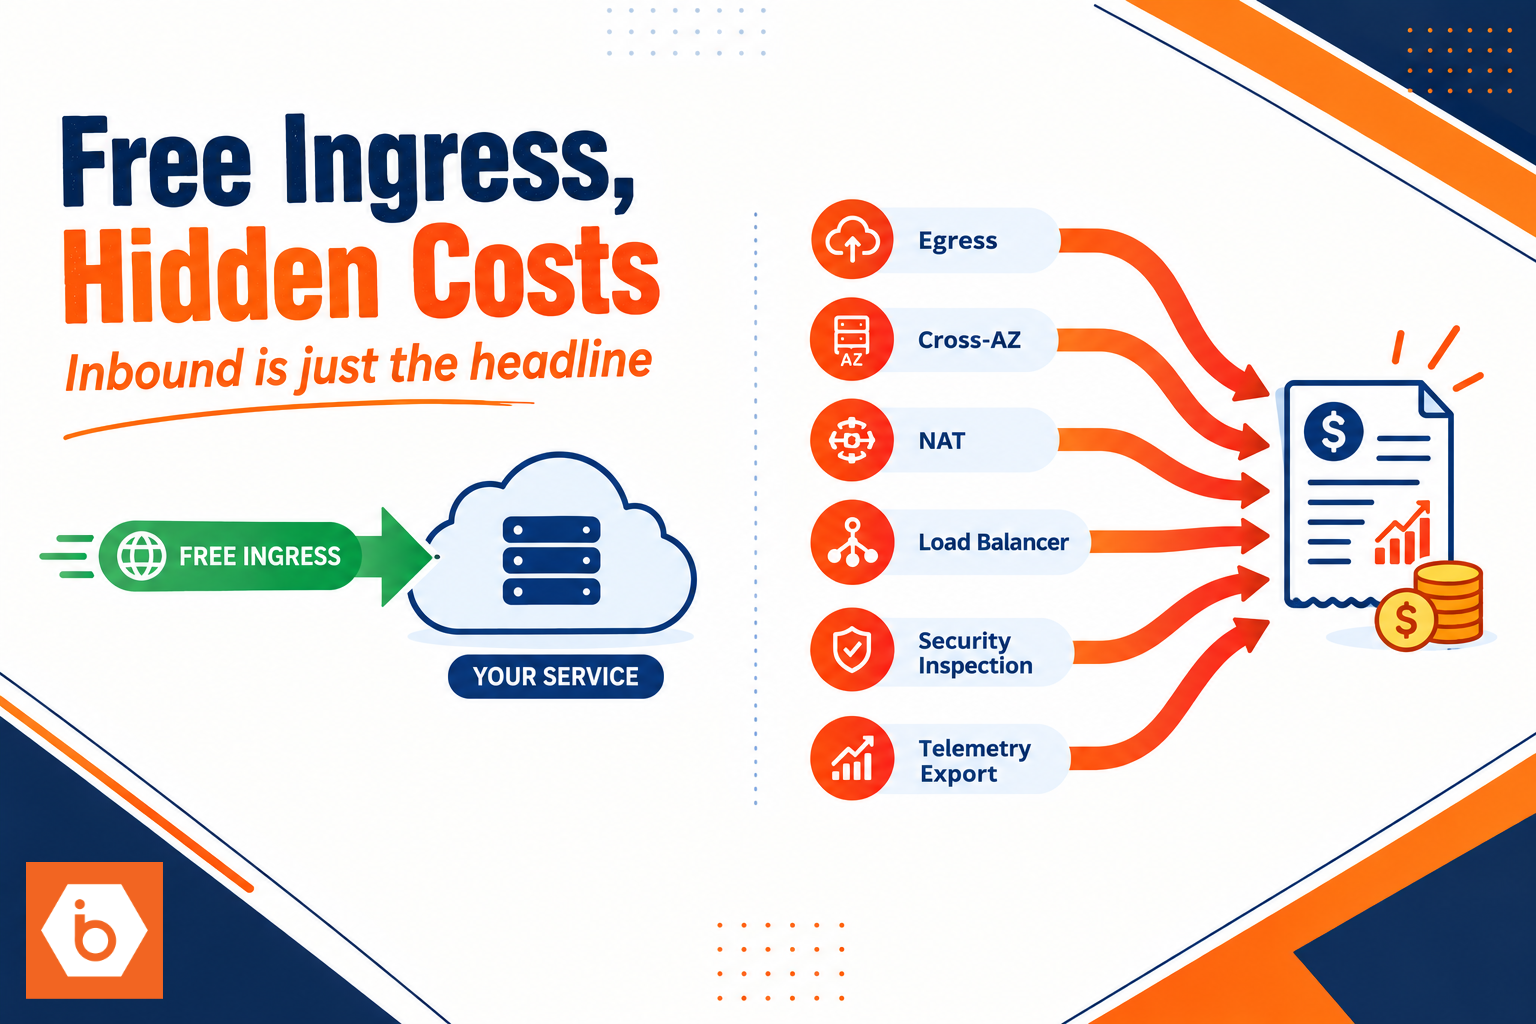
Required visual: where the money actually comes from
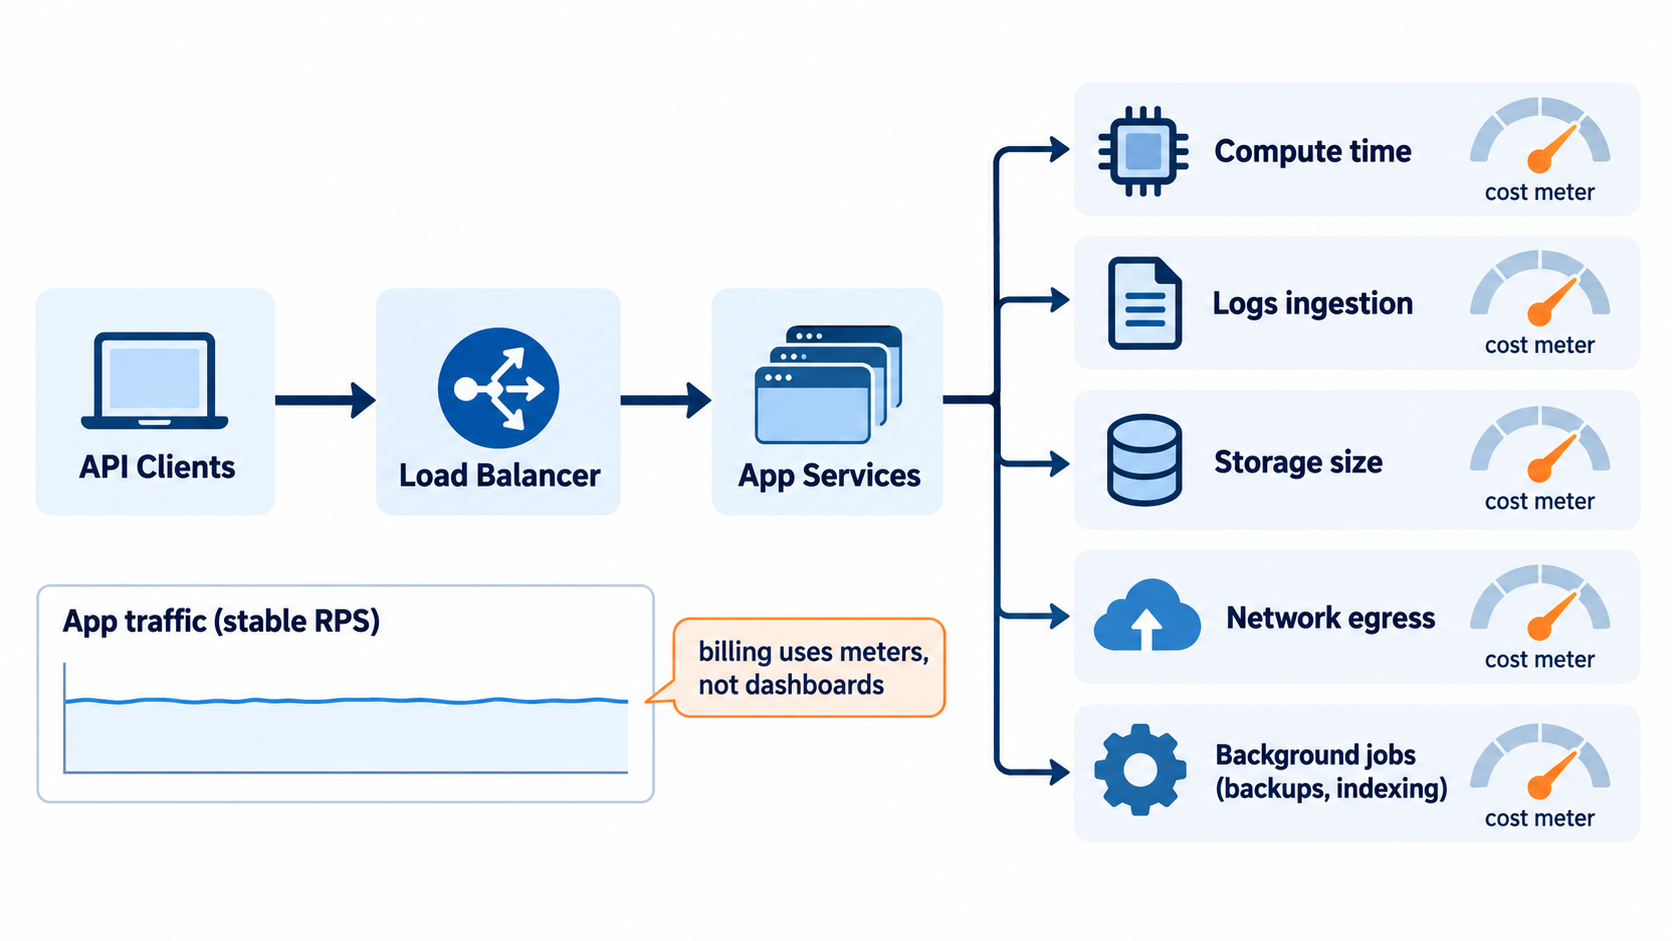
It maps normal request flow to the billing meters that can grow without obvious traffic changes.
Why bills grow while RPS stays flat
Let’s talk mechanics. Bills rise when any billable dimension rises, even if the request count you track stays constant.
1) You scaled for the wrong signal, or min capacity drifted
Autoscaling policies rarely scale on “requests per second.” They scale on CPU, memory, queue depth, or custom metrics that can wiggle for reasons unrelated to user traffic.
Common pattern: your traffic is steady, but dependencies get slower. For example, your database response time creeps up due to cache misses or lock contention. Your app spends longer per request, so CPU time per request increases. Autoscaling sees CPU or queue depth rise and adds instances. Your dashboards show “same traffic,” but the infrastructure bill counts “more compute time.”
Then there’s the silent killer: minimum instance counts. You set min replicas to 2 during launch week. Then you add a new cron job, enable a new feature flag, or change a rolling update strategy. Your team doesn’t change min replicas, but the system behavior changes enough that the autoscaler keeps sitting at the higher floor.
Most teams get this wrong when they treat autoscaling as a set-and-forget knob. They never audit “desired vs actual capacity over time” after the system stabilizes. They also don’t correlate scaling events with deploys, config changes, or background workload schedules.
2) Retries and timeouts create invisible request amplification
Your monitoring might track successful requests only. Retries often don’t show up there, especially if the first attempt fails before a “success” counter increments.
Retries happen when any hop becomes flaky: network blips, throttling (429), transient 503, TLS handshake failures, database connection pool exhaustion, or upstream timeouts. Your client or service retries, sometimes with exponential backoff, sometimes with jitter. Either way, you pay for extra compute time, extra load balancer processing, and sometimes extra network transfer.
The bill doesn’t care whether the user got one response or three attempts. It cares that your infrastructure processed three times as many request attempts.
How you catch this: check retry counters, client-side metrics, and distributed traces for repeated spans per request. Look at load balancer target response codes and latency breakdowns. If your p95 latency is stable but your CPU is climbing, retries are a prime suspect.
3) Logging and observability costs jump when you “just debug”
This is usually the #1 surprise. Teams enable verbose logging to chase a production issue. It works. Then nobody turns it back down.
Cloud logging often charges for ingestion volume and storage retention. If you start logging request and response bodies, stack traces at higher frequency, or add high-cardinality fields (user_id, session_id), your log volume can multiply fast. Even if your app traffic is constant, your per-request log size might increase, and retention might get extended from 7 days to 30 or 90.
Also watch for duplication. A common failure mode is double ingestion: two agents, two pipelines, or logs being shipped both from the node and from the container runtime. That can double your ingestion while your application metrics still look “normal.”
If you want a quick sanity check: compare log ingestion GB/day over time against your deploy history. If they diverge, you found your culprit.
4) Data transfer costs rise from “small” changes in payloads and caching
Egress is where budgets go to die quietly.
Your app can have stable request count while response payloads grow. A new field in your JSON can be a few hundred bytes. Multiply by millions of requests and the egress bill moves. Add periodic large exports, media downloads, or streaming chunks and it moves even faster.
Caching changes everything too. If your CDN cache hit ratio drops, you suddenly fetch from origin more often. That increases egress from origin and can also increase compute because your origin has to generate more content.
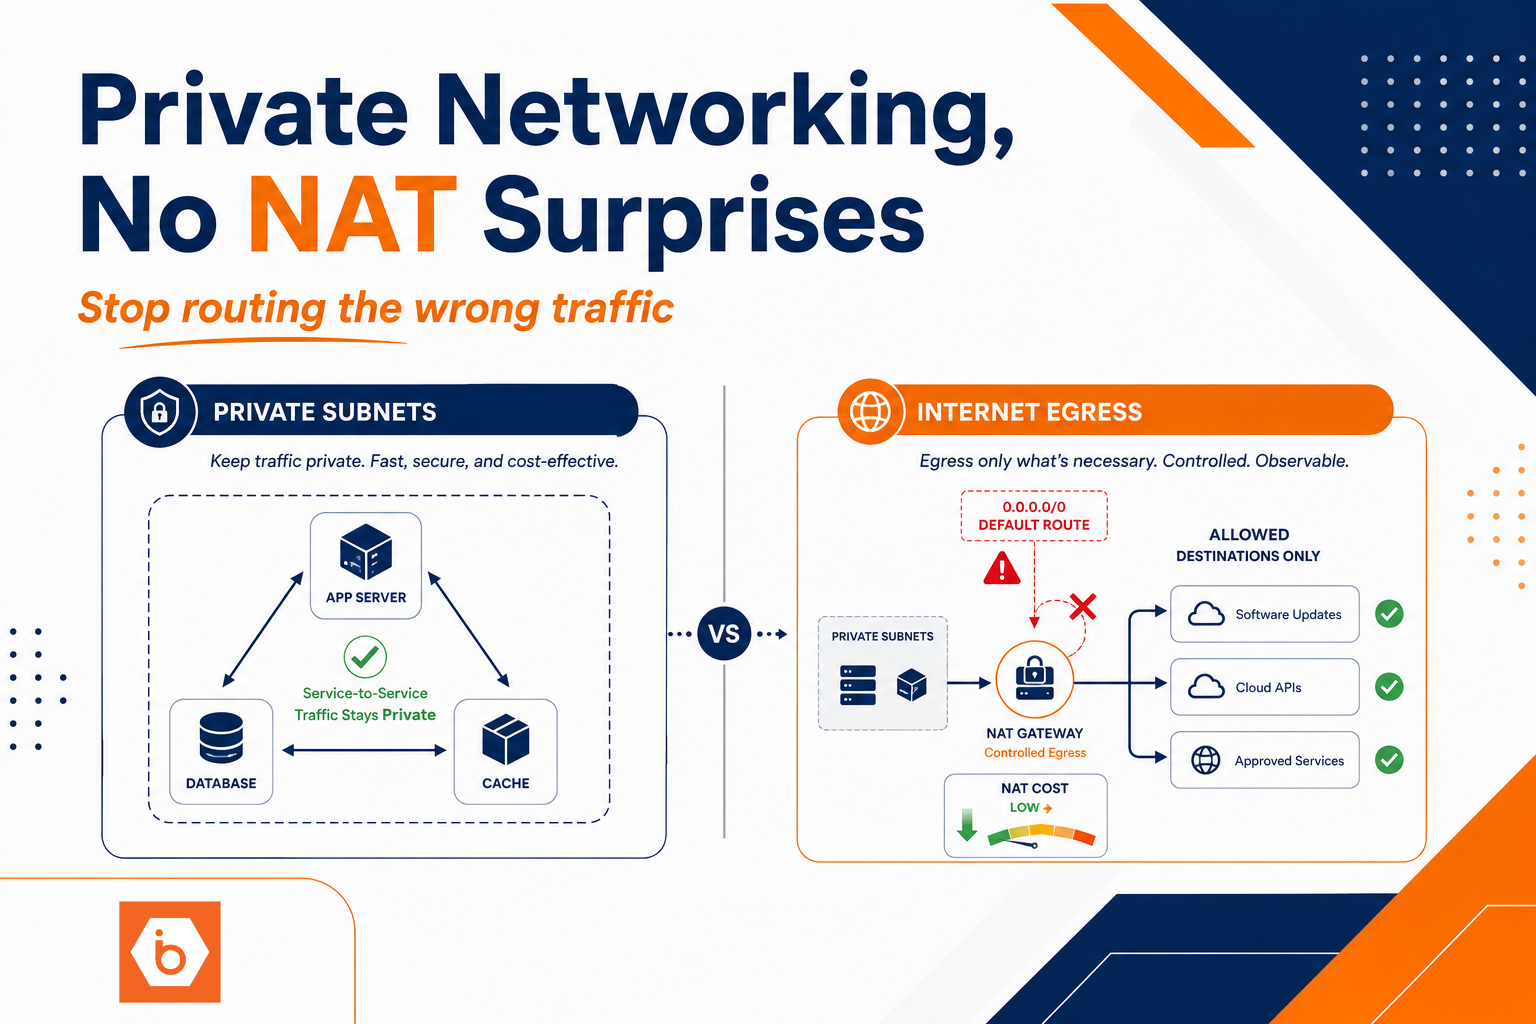
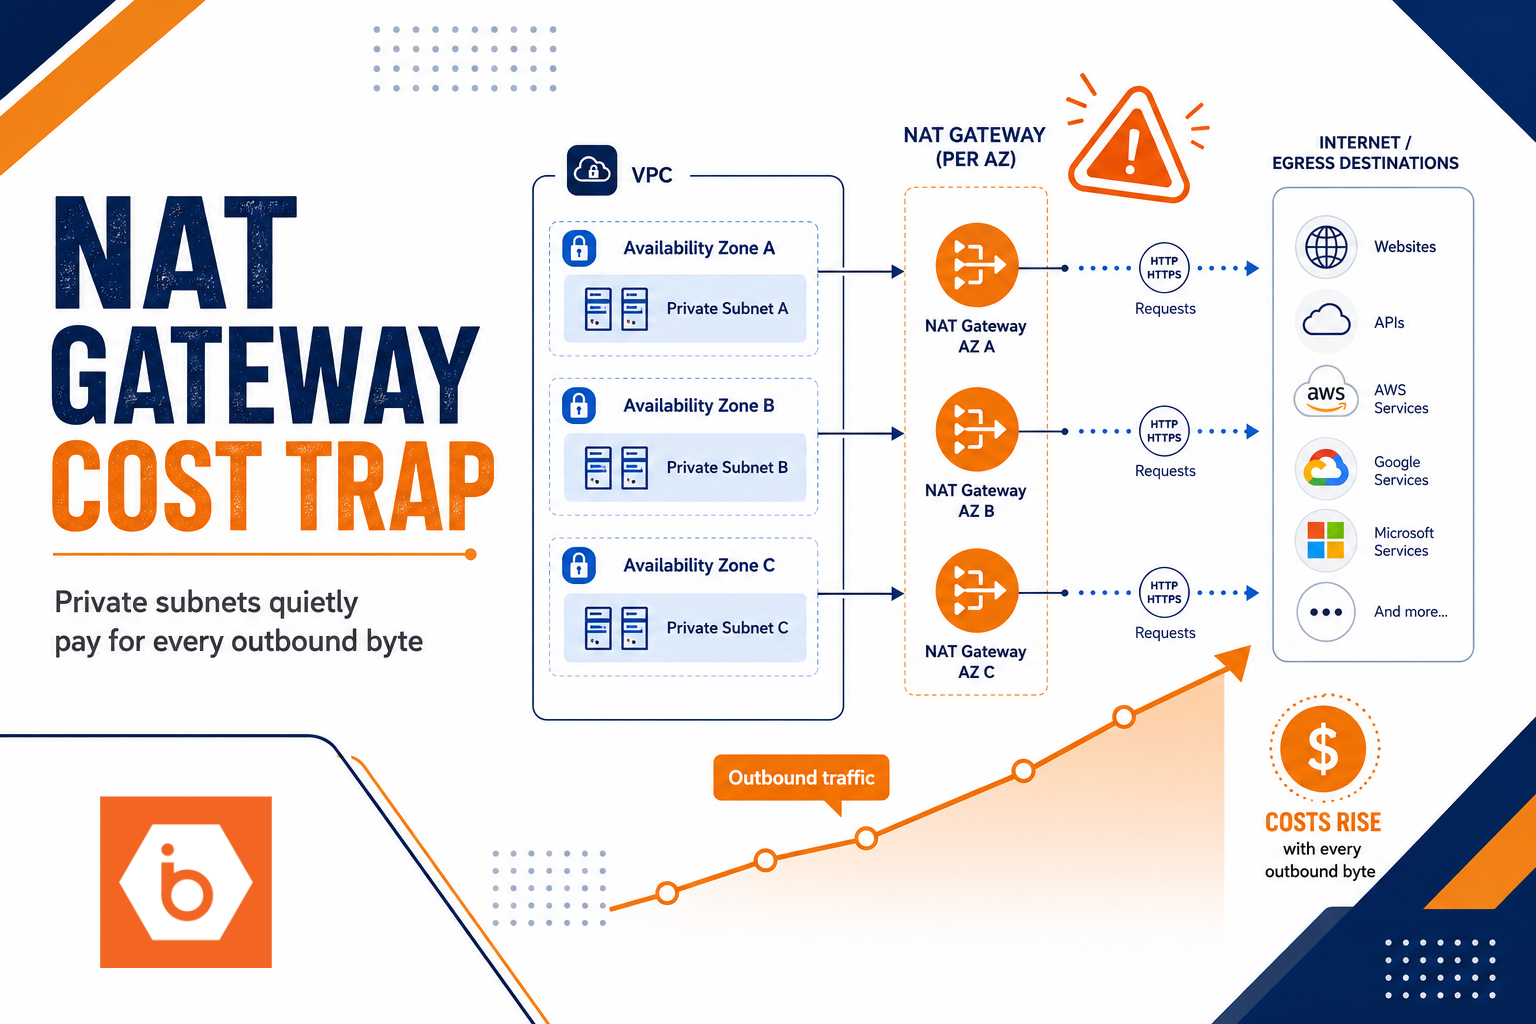
Cross-zone and cross-region traffic can also rise without obvious user impact. For example, a new dependency starts resolving to a different endpoint or your service mesh routes differently after a rollout.
How you catch this: break down egress by destination and by service. Track CDN cache hit ratio and origin fetch count. If you see egress increase while RPS is flat, your payload or caching behavior changed.
5) Storage grows due to retention, failed cleanup, and background jobs
Storage costs rise in two ways: capacity and operations.
Capacity grows when objects accumulate. That happens when lifecycle rules are missing, retention policies don’t expire, cleanup jobs fail, or you keep old artifacts “just in case.” Operations costs can rise too when you reprocess data, reindex, or run frequent backup and snapshot schedules.
Backups and snapshots are a special trap. Teams often increase backup frequency for safety, then keep it indefinitely. Or they snapshot volumes that include large caches and build artifacts. Even if your app traffic is stable, the backup cadence can drive storage growth and operational overhead.
If you’re using object storage for artifacts, datasets, or user uploads, check: bucket growth over time, lifecycle rule effectiveness, and whether any pipeline retries are creating duplicates.
The “unit mismatch” problem: what to measure instead of guessing
You need to stop asking “why did traffic change?” and start asking “which meter moved?”
Here’s the workflow your team should use:
- Pull your bill by service for the last 30 to 90 days and identify the biggest movers (compute, logs, network egress, storage).
- For each mover, map it to a concrete infrastructure behavior: autoscaling events, retry spikes, log ingestion volume, CDN cache hit ratio, storage growth rate, backup frequency.
- Correlate those behaviors with deploys, config changes, and scheduled jobs. If a cost jump lines up with a release, you already have your candidate.
- Validate with instrumentation, not vibes. For example, if compute time rose, confirm increased CPU per request or increased instance-hours. If egress rose, confirm payload size and cache miss rate.
This is where teams waste weeks. They collect too much data at once and never tie it back to a specific meter. Or they only look at application dashboards and ignore infrastructure and billing breakdowns that actually explain the delta.
One real example: “stable API” but logs doubled
A mid-stage e-commerce team saw their bill climb 25 percent over a month while RPS was essentially flat. Latency was fine. Error rates were fine. The team blamed “more traffic,” then realized their traffic graphs didn’t match the bill.
The real change was a debug flag enabled during a rollout. It logged full request bodies for validation failures. That sounded harmless because validation failures were “rare.” But a small client-side bug caused validation failures to happen for a subset of requests repeatedly. RPS stayed flat because the requests still landed, but log ingestion volume doubled because each attempt logged a larger payload and stack trace.
The fix was boring: reduce log verbosity, strip request bodies from error logs, and cap retention for debug logs. The bill dropped because the meter stopped moving.
How to stop this from happening again
You can’t eliminate cost variability. You can eliminate surprise.
First, treat cost as an engineering signal, not a finance report. Build a cost dashboard that mirrors the billing meters: instance-hours, log ingestion GB/day, egress GB, storage GB, and snapshot frequency. Then set alerts on meter deltas, not just on absolute spend.
Second, enforce guardrails in CI/CD and runtime configs. If someone enables verbose logging, you should require a short-lived override with an expiry. If someone changes log retention, it should go through review like a schema change. If someone changes autoscaling min replicas, it should be tied to a capacity plan.
Third, make retries visible. Add tracing that includes attempt counts and upstream error classification. If your system retries, your traces should show it. If your client retries, your metrics should show it. Otherwise retries become a hidden tax.
Finally, right-size storage and lifecycle policies. Objects and logs don’t “stop” growing because your app stopped. They grow because cleanup didn’t happen. Put lifecycle rules in place, monitor bucket growth, and alert when retention jobs fail.
If you want a practical starting point for storage-heavy workloads, you should also track how much data you store and how much you ship out, because both can change independently of request counts. For example, if you move static exports and assets to object storage with predictable S3-compatible behavior, you can make storage and egress costs easier to reason about and audit, instead of debugging a mess of ad hoc volumes and instance disks.
Do this today: identify the exact meter that moved
Pick one cost spike from the last billing period and do this in one sitting:
- In your cloud billing view, sort services by cost delta (not total cost).
- Click the top 1 to 2 services and extract the usage metric behind the delta (compute time, log ingestion GB, egress GB, storage GB, snapshot count).
- Pull the timeline for that metric and correlate it with your last 2 to 5 deploys and any scheduled jobs.
Once you can say “log ingestion GB/day doubled after deploy X” or “egress GB rose because cache hit ratio dropped,” you stop guessing and you start fixing.