
The migration that quietly doubled your traffic
The migration took six weeks. Three of them were spent undoing a decision made in the first hour.
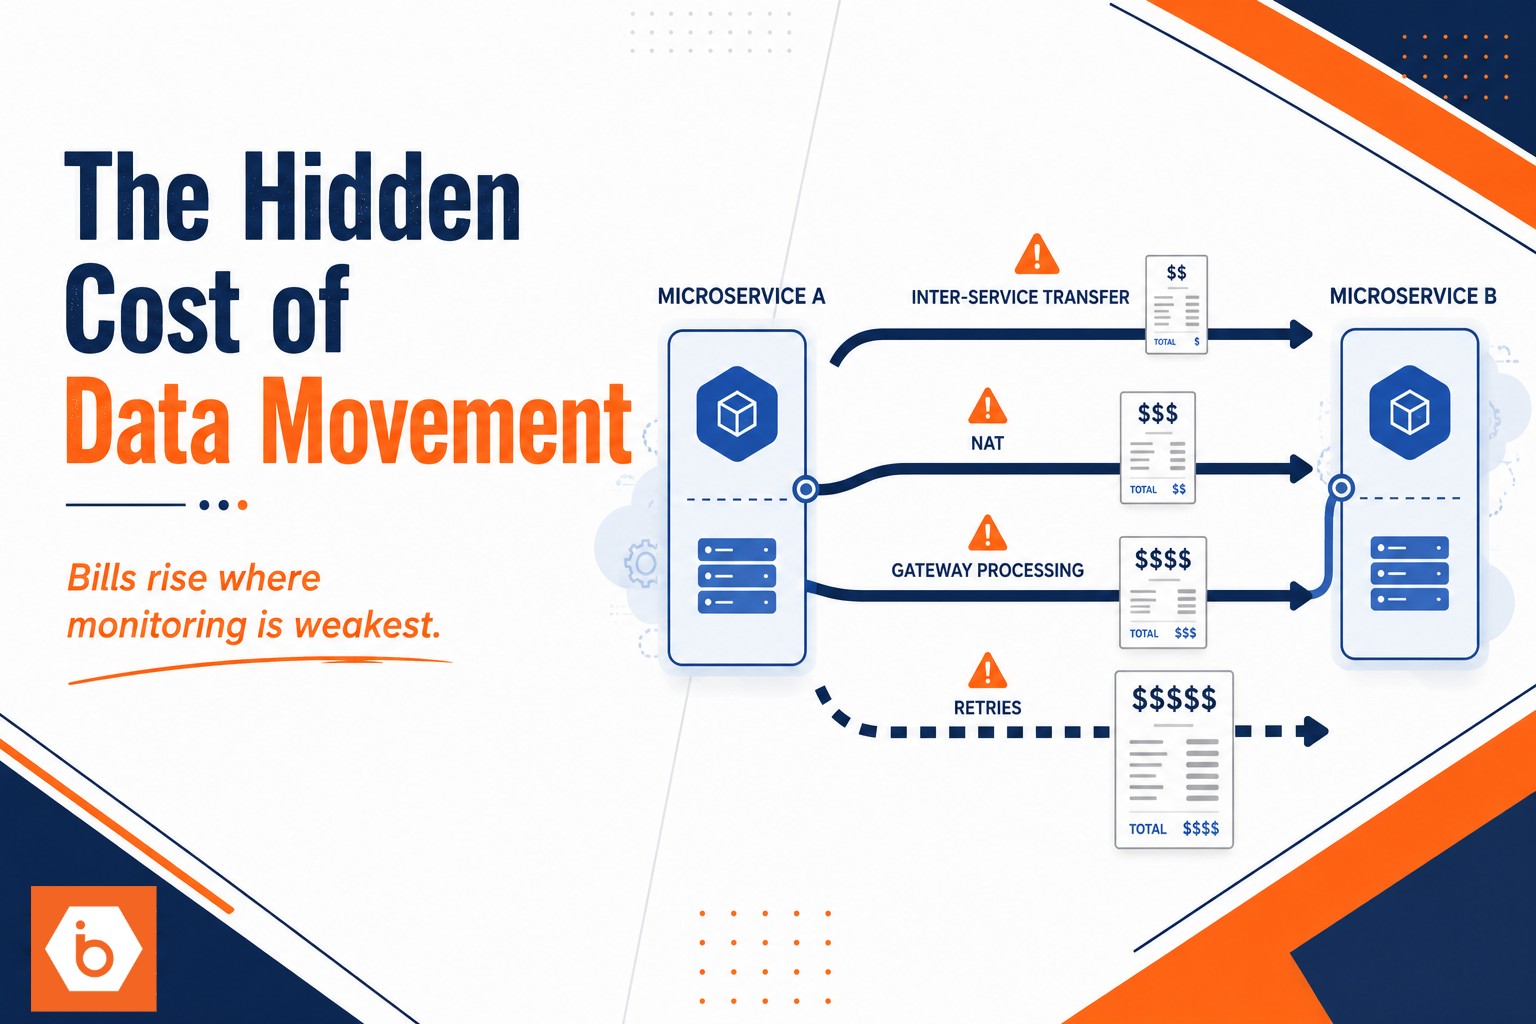
Your team “modernized” the service by splitting one monolith into two microservices. Locally and in staging it worked. In production, the bill didn’t just rise. It rose in the exact places nobody monitors until the finance email lands: inter-service transfer, NAT, gateway processing, and retries.
Here is the uncomfortable truth: most teams choose their compute first, then they discover their data movement model later. They treat data transfer like plumbing. It is not. In cloud systems, data movement is a product feature with a price tag.
Most teams get this wrong in a very specific way. They optimize payload size at the API boundary, then they accidentally re-expand it inside the pipeline. JSON becomes base64 becomes larger JSON again. A “small” event fans out to three downstream calls. Each downstream call retries independently. By the time the data reaches storage, you have moved the same logical bytes five to ten times.
Where the hidden costs actually come from
You can’t manage what you can’t name. Data transfer costs show up in different buckets, and they stack.
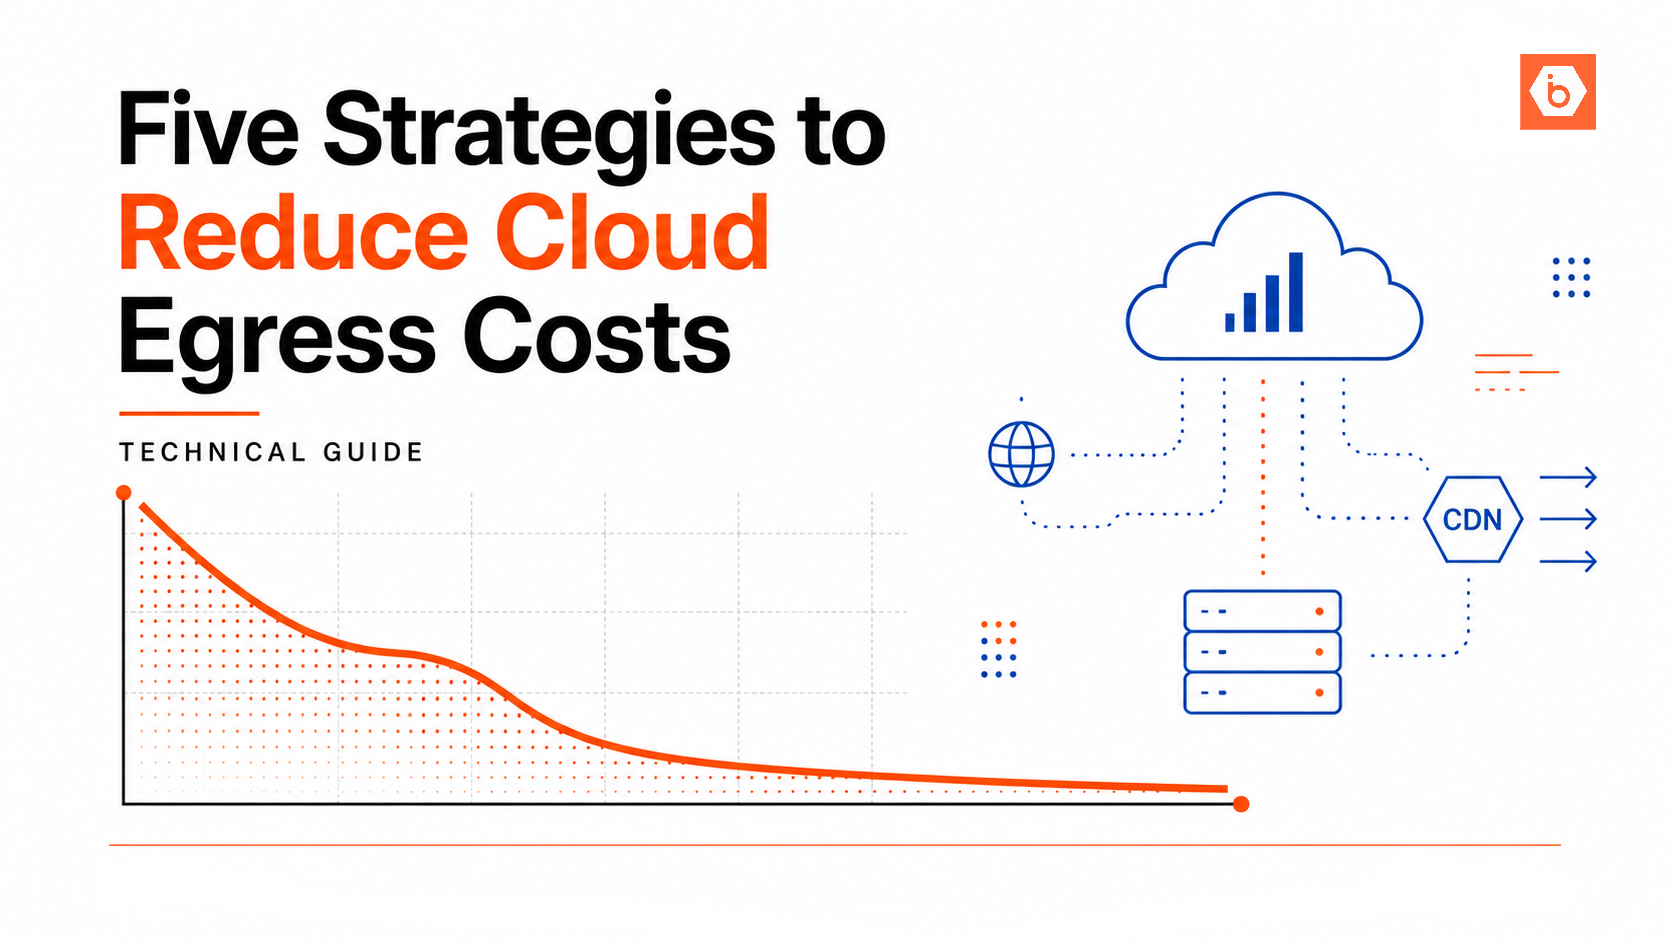
First, there are the obvious direct charges. Egress is usually the biggest line item when traffic leaves your region or goes to the public internet. Inter-region replication for DR and multi-region setups keeps moving bytes even when nothing fails. Load balancer and API gateway data processing charges show up when you send lots of requests or large payloads through managed front doors. NAT gateways can look “private” while still billing you per hour and per GB for outbound traffic.
Second, there are the indirect costs that don’t look like “data transfer” but behave like it. Latency makes you scale concurrency. Concurrency increases in-flight data. In-flight data increases memory, queue depth, and retry rate. Retries multiply traffic. Fan-out multiplies traffic. And because retries often happen after timeouts, you also waste compute cycles that you thought you were paying for.
Third, there are architecture costs. When you route through extra security layers or multiple managed services, you add hops. When you duplicate data across services “just to keep it simple,” you multiply storage and transfer. When you build multi-hop ETL pipelines that read and write the same dataset repeatedly, you pay transfer costs for every pass.
Finally, there is governance overhead. Encryption key management, audit logging, and compliance controls often require extra metadata movement and extra calls to key services or logging backends. Those calls add more hops and more bytes, and they also increase the probability of timeouts and retries.
The result: your end-to-end cost becomes a function of hop count, payload size, and retry behavior, not just request volume.
The hop multiplier problem (and why it beats your intuition)
Let’s talk about the mechanism that makes this nasty: the multiplicative effect.
A single user request often triggers a pipeline like this.
1) Client to API gateway or load balancer 2) Gateway to compute 3) Compute to database or cache 4) Compute to object storage or streaming 5) Stream to another compute stage 6) Compute to downstream service 7) Downstream service back to client
If each hop moves “the same data,” total transferred bytes become several multiples of the original payload. And you rarely move the same bytes. Headers, serialization format, compression settings, and encoding choices change the bytes on the wire.
Now add retries. A transient failure at hop 4 makes hop 5 never see the data. Your system retries hop 4 and hop 5 independently. If your fan-out is 1 to 3, you now have 3 retry streams. Even if the downstream eventually deduplicates, the transfer already happened.
Here is one number that should scare you: in many real systems, egress can dominate cloud spend once traffic grows beyond a threshold. You might think that threshold is “when you have a lot of users.” It is not. It is when your architecture starts moving data across boundaries faster than you amortize it.
This is why teams feel like their compute optimization did nothing. They reduced CPU by 20%. Meanwhile, the system moved 2x to 5x more data because the hop multiplier and retries took over.
Visualizing your data flow before you touch code
You need a cheap, brutal inventory of where bytes move. Not a diagram you will “keep updated forever.” A diagram you can use to catch the obvious cost leaks in a day.
Required step: trace one end-to-end request in production and annotate each hop with “bytes in” and “bytes out.” If you cannot get exact bytes, approximate with payload sizes and response sizes. The point is to find multiplicative patterns, not to build a perfect estimator.
Then look for these cost amplifiers:
Most teams get this wrong: they measure only the first request. They ignore everything that happens after the first failure or after the first fan-out. If your architecture has background processors, queues, or event handlers, you must include them. Otherwise you will miss the part of the pipeline that actually burns bandwidth.
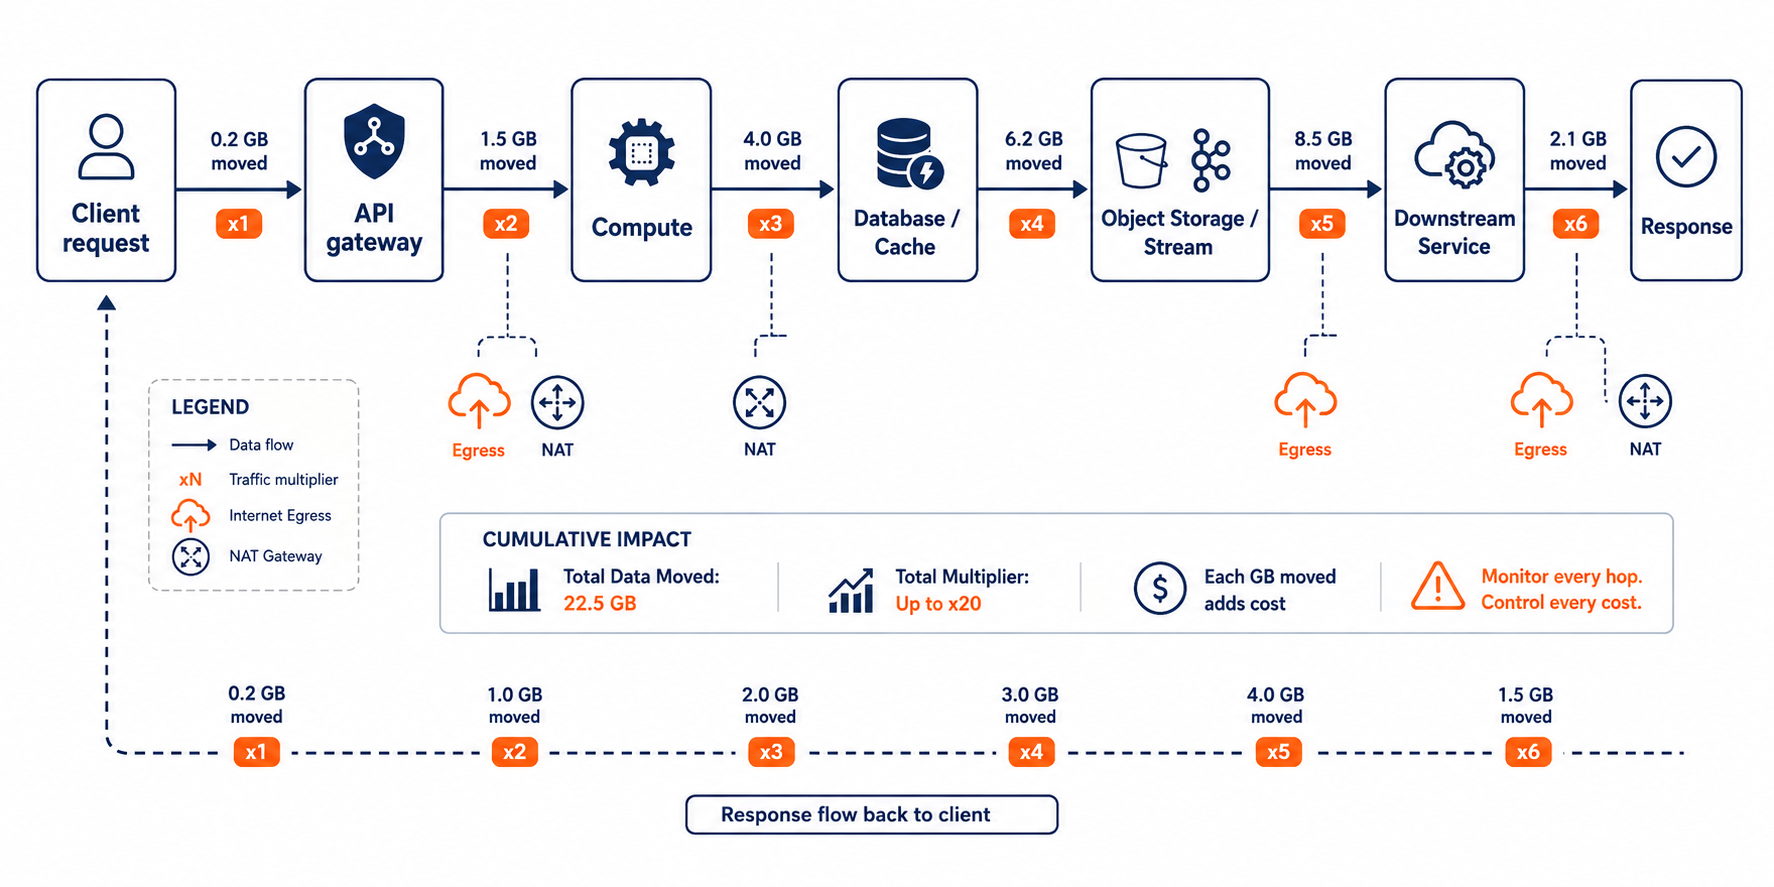
A request triggers multiple hops, and each hop multiplies transferred data.
What to change: reduce hops, reduce payloads, reduce retries
You do not fix this with one setting. You fix it with a few targeted design moves.
Start with hop reduction. If you can collapse two services into one boundary for the hot path, do it. If you can avoid routing through an extra managed layer, do it. If you can keep data in the same service boundary, do it. The best hop is the one you delete.
Next, reduce payload bloat. This is where you catch the “same data, bigger bytes” problem. Replace verbose JSON payloads with compact binary formats where it makes sense. Stop base64 encoding large blobs inside messages. Store the blob in storage and pass only a reference. Use compression for large text payloads, but measure it. Compression can reduce bytes and increase CPU. If your CPU is already tight, you might trade one cost for another.
Then, fix retry behavior. Retries are not automatically good. They are good when you retry idempotently and when the failure is truly transient. If your retry triggers full reprocessing, you multiply traffic and also multiply load. Add backoff with jitter, cap retries, and ensure downstream operations deduplicate or become idempotent. Also, timeouts should reflect reality. A too-short timeout creates retries. A too-long timeout increases in-flight data. Find the point where retries drop without causing cascading backlog.
Finally, control fan-out. If one event causes three downstream calls, that is three transfers. If you can batch downstream operations, do it. If you can move from synchronous fan-out to asynchronous processing, do it, but watch for queue backlogs that later cause re-emission storms.
If you need a concrete pattern: keep large artifacts in object storage and move only references between services. Your services should pass keys and metadata, not full blobs. That changes your data movement model from “ship bytes everywhere” to “ship small pointers.”
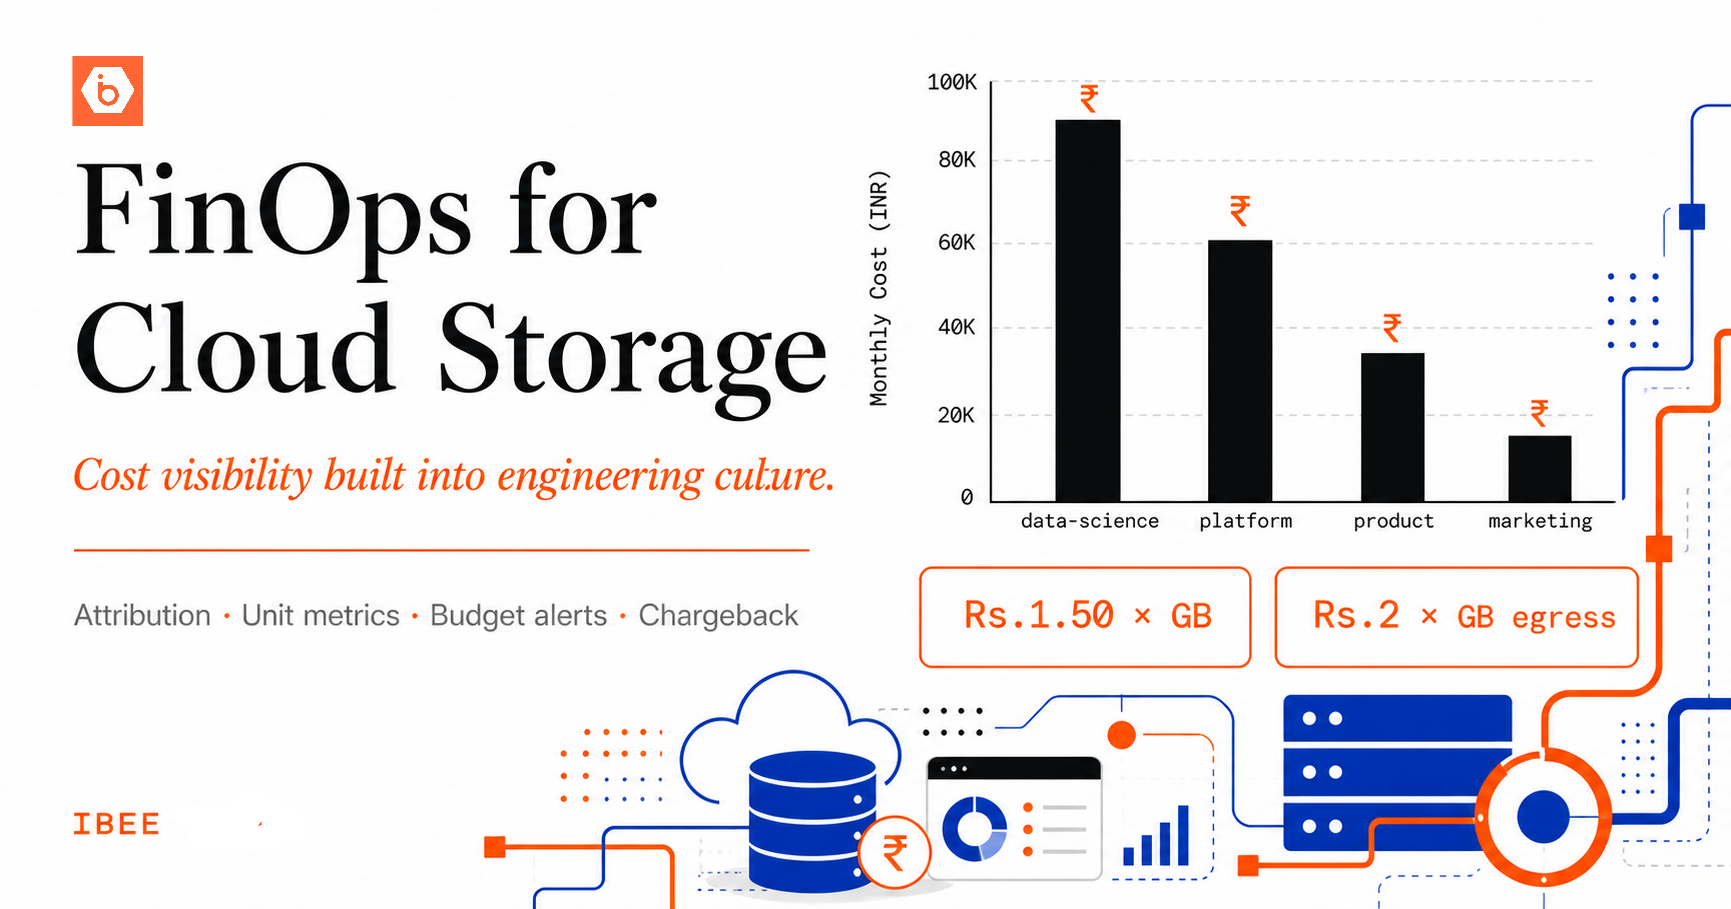
When you do this with IBEE Object Storage, you can keep S3-compatible workflows and avoid application rewrites while you reduce cross-service traffic. The pricing also matters when egress becomes unavoidable. IBEE charges ₹2/GB egress, and internal traffic within the infrastructure is free, which helps when your pipeline still has unavoidable multi-hop reads. You still need to design the hops, but at least the bill stops exploding for the bytes you cannot eliminate.
How to measure success without guessing
You need a before-and-after metric that correlates with your data movement costs. Do not rely on “CPU down, so cost down.” That lies.
Track these three things for one representative workload:
First, total bytes transferred per request end-to-end. Use logs or tracing spans to estimate payload sizes at each hop. You are looking for hop count and multiplication, not exact accounting.
Second, retry rate and retry-induced duplicates. Count how many times each stage reprocesses the same logical operation. If retries spike during partial failures, your data movement costs will spike too.
Third, queue depth and time in system for async stages. Backlogs cause reprocessing and retries, which cause more bytes moved when the system catches up.
Then run a controlled change. Pick one: reduce payload size, remove one hop, or make one stage idempotent. Roll it out to a slice of traffic. Compare the three metrics above. If they improve, you fixed the data movement model. If they do not, you changed something else.
Real-world example: a mid-size fintech team we worked with moved from synchronous enrichment calls to an async pipeline. They assumed “async means cheaper.” It did not at first. Their retry policy caused a reprocessing loop during a dependency outage. Once they capped retries and made enrichment writes idempotent, transferred bytes per request dropped sharply and the bill stopped climbing during incidents. The lesson: async without retry control just changes when the bill hits.
One action you can take today
Pick one critical API endpoint and draw its full data path with bytes at each hop. Include retries and fan-out. You can do this from tracing and logs in a few hours. Then delete one unnecessary hop or replace one “blob in message” transfer with “store blob, pass reference.”
Do that, and you will feel the hop multiplier disappear in your next billing cycle.