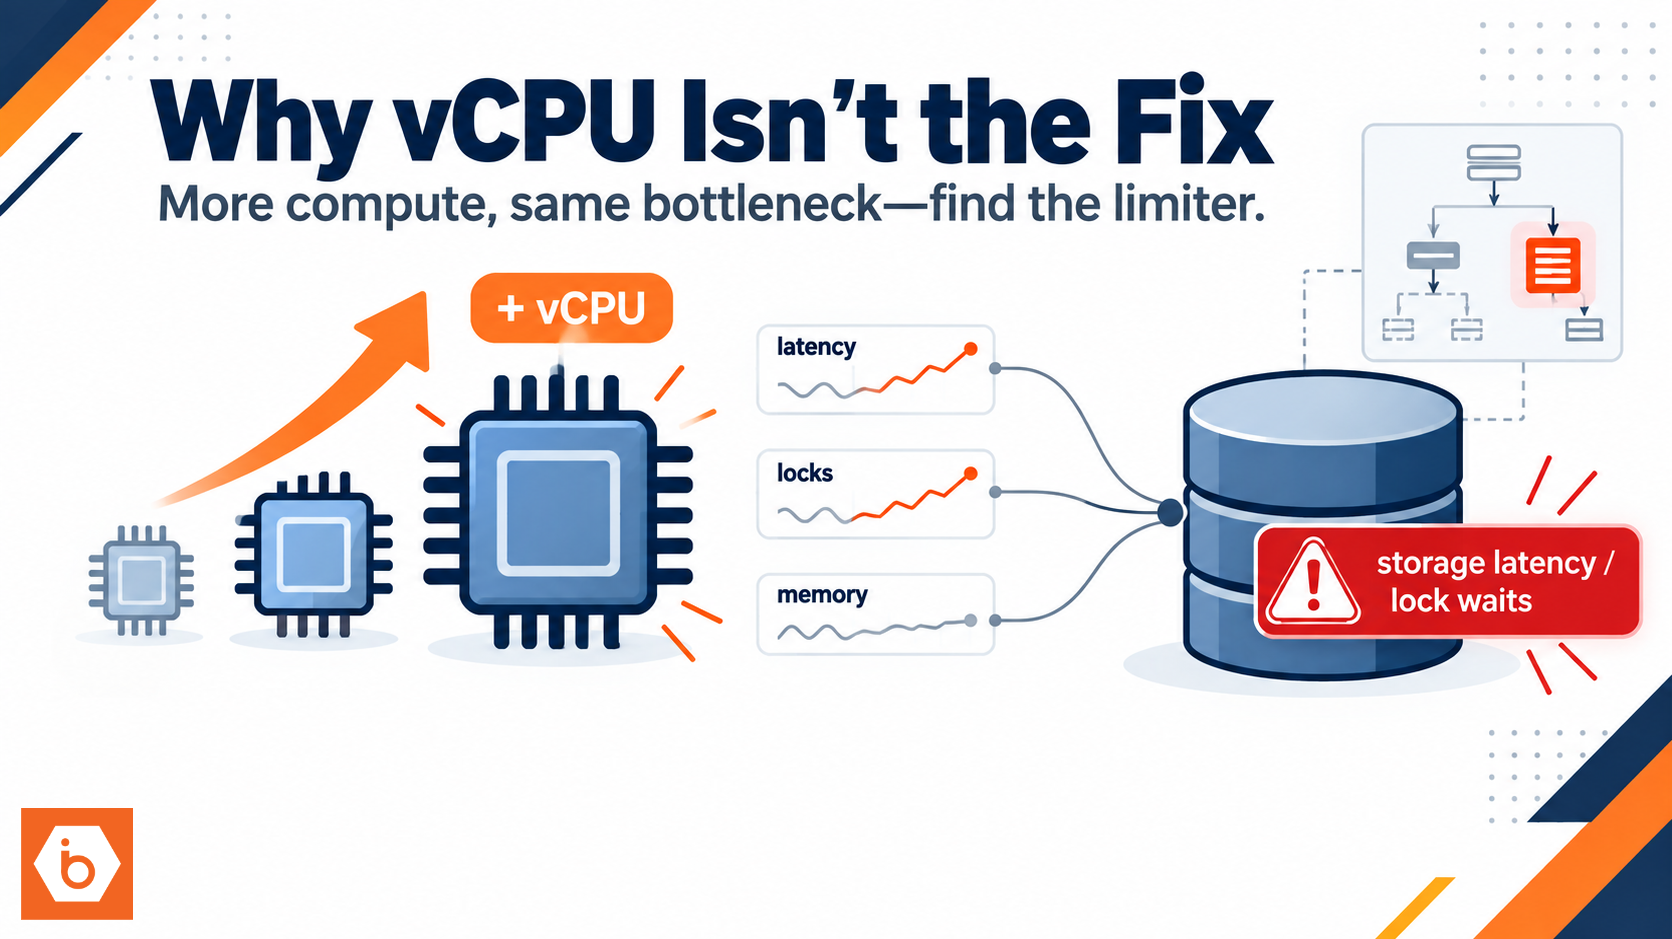

You increased vCPU. Your dashboards look “healthier.” And yet the app still crawls.
The uncomfortable truth: most teams choose compute first and diagnose later. You throw more vCPU at the database because it feels like the obvious lever. Then you discover the real limiter never moved: storage latency, lock waits, memory pressure, or a bad plan that keeps forcing expensive work.
Here’s the blunt pattern you’ve probably seen: the change is done in one afternoon, and the investigation takes weeks because you didn’t capture the evidence before and after.
The fastest way to waste money: raising vCPU while the wait event didn’t change
Databases do not get slower because they “need more CPU.” They get slower because a specific resource in the critical path is making your queries wait.
So the question is not “Did CPU go up?” The question is “What are the queries waiting on now?”
If you increased vCPU but the dominant wait type stayed the same, performance won’t improve. You simply gave the database more threads that still can’t get what they need.
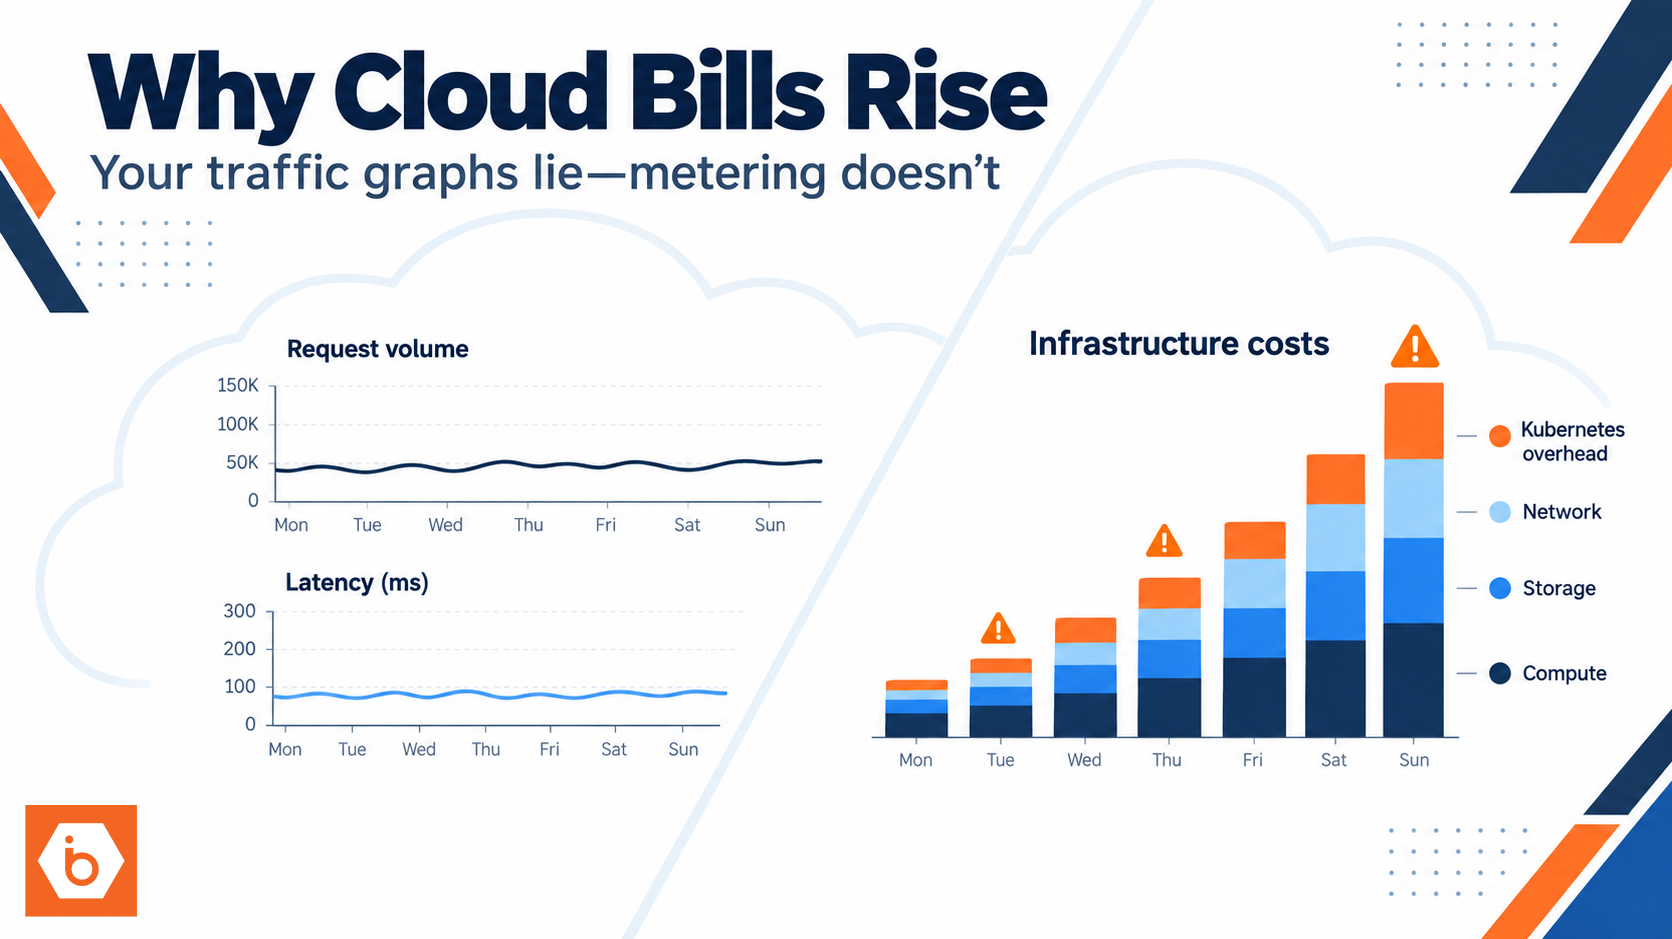
Most teams get this wrong in a very specific way. They look at average CPU utilization and call it a day. Average CPU can be totally misleading because database workloads often wait in bursts. You can have “only 35% CPU” and still be throttled by I/O latency or lock waits. Average hides the tail, and databases live in the tail.
What to check immediately after the vCPU increase: You want to compare “before vs after” at the same time window, same workload, and ideally same query mix. Then identify the top wait categories. Most engines expose this directly as wait events or similar breakdowns.
If the top waits are:
- storage reads or writes, you are I/O-bound
- lock-related waits, you are contention-bound
- memory spills or temp file usage, you are memory-bound
- network or replication apply waits, you are distribution-bound
- CPU scheduling delays (common on VMs), you are virtualization-bound
When vCPU helps, you’ll see the dominant waits shift away from the bottleneck. When it doesn’t, you’ll see the same waits remain dominant, sometimes with even worse latency because you added parallelism that amplifies the bottleneck.
What vCPU actually changes (and what it doesn’t)
vCPU increases the number of execution slots the database can use. That helps only when your workload is truly CPU-bound and the engine can keep those cores busy without running into other limits.
But vCPU does not magically fix:
- storage latency: random reads and transaction log flushes still take the same time
- cache misses: if your working set doesn’t fit in memory, you’ll still wait on disk
- locks: more workers do not reduce conflicts, they increase them
- bad plans: more CPU can speed up a bad plan’s wasted work, not make it correct
- VM scheduling: the guest can be ready to run but not scheduled, so it still waits
A common trap on virtualized infrastructure is CPU scheduling contention. Your VM can show “higher CPU capacity,” but the database threads spend time waiting for the hypervisor to schedule them. In that case, adding vCPU can increase overhead and worsen cache locality.
Also, many databases increase parallel query workers when you add CPU. That can backfire: More parallel workers means more memory consumption per query, more temp usage, more pressure on shared indexes, and more concurrent I/O. If your storage is already saturated on random I/O, parallelism just increases queueing and tail latency.
The real bottleneck is usually storage I/O latency, not throughput
Throughput numbers lie. Databases care about latency and IOPS, especially for OLTP patterns: lots of small reads, index lookups, and frequent writes to transaction logs.
Two practical signals that point to storage as the culprit: First, CPU stays moderate or low while query latency and p95/p99 get worse. Second, you see waits tied to reads, writes, log fsync, checkpoint, or similar storage operations.
Even if you increased vCPU, storage can still be the limiting factor because:
- random I/O drives query execution time more than sequential throughput
- log flush determines commit latency for write-heavy workloads
- write amplification happens through index maintenance and background tasks
- queueing increases tail latency as concurrency rises
Here’s one statistic that matters: for OLTP, commit latency often tracks storage flush latency. If you can’t push log fsync fast enough, every transaction pays that cost. More vCPU won’t change the time it takes to flush the log.
Now zoom in on what “storage sizing” really means. You need IOPS capacity and latency, not just GB. If your database is doing lots of small random operations, you can have “plenty of free space” and still be dead in the water.
If you’re on Block Storage, pay attention to how you provision IOPS and throughput. For example, IBEE Block Storage is NVMe-backed with DRBD 2-replica redundancy on a 3-node LINSTOR cluster, and the plans are sized with defined IOPS and throughput ceilings. That matters because your database doesn’t care that the volume is “big enough.” It cares that it can hit the latency and IOPS profile your workload demands.
Memory pressure and locking: the two “CPU looks fine” killers
This is where you get stuck for weeks if you keep staring at CPU charts.
Memory pressure
If your buffer cache is too small for your working set, the database keeps doing page fetches. That turns CPU work into waiting work. You’ll see symptoms like:
- temp spills during sorts and hash operations
- increased disk writes from temp files
- higher read waits even when CPU is not pegged
vCPU can even make it worse if parallel workers increase memory usage per query. More workers means more hash tables, more sort buffers, more temp spill risk.
Locking and contention
Locks are brutal because they serialize your workload. When you add vCPU, you often increase concurrency and parallel execution, which increases the number of lock conflicts.
Symptoms:
- low CPU but high wait time
- lock wait events dominating
- long-running transactions holding locks while many others pile up
Most teams get this wrong by tuning isolation level or increasing connection limits without finding the conflicting access pattern. If the same rows or pages get hit by many transactions, you need to change the query, indexing, batching strategy, or transaction scope. You can’t “scale” your way out of hot contention.
One real-world clue: if your slowdowns correlate with specific endpoints or background jobs, you likely have contention or memory pressure tied to those operations. Debugging becomes straightforward when you map wait events to query patterns.
A practical diagnostic workflow that doesn’t waste time
You need a repeatable process. Not vibes.
- Capture a baseline window before the vCPU change: query latency (p50/p95/p99), throughput, and wait event breakdown.
- Apply the vCPU change and capture the same metrics for the same workload window.
- Compare dominant wait types. If the top wait categories did not change, stop chasing CPU and move to the dominant resource.
- For storage suspected cases, check IOPS saturation, queue depth, log fsync latency, and whether p99 latency tracks log or read waits.
- For memory suspected cases, check temp spill counts, work memory settings, and whether parallelism increased temp usage.
- For locking suspected cases, identify the top blocked queries, the lock mode, and the hot objects. Then reduce transaction scope and fix access patterns.
- For plan suspected cases, collect the execution plan for the slow queries and verify index usage, join order, and updated statistics.
This workflow is boring, which is why it works.
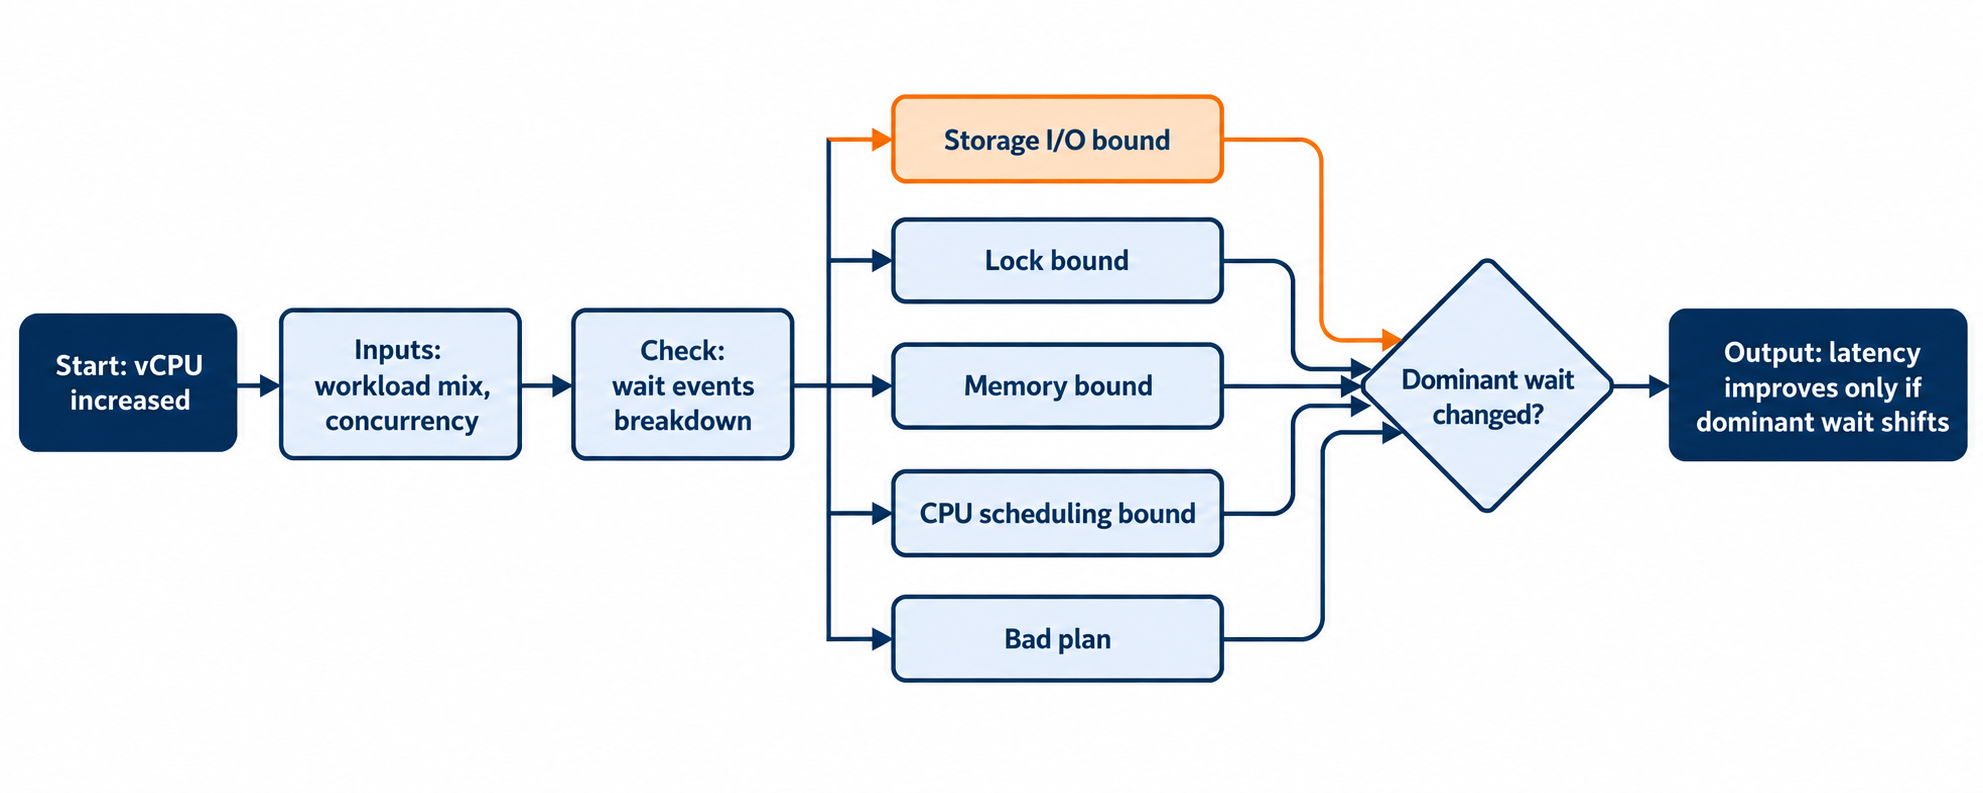
This shows how “more vCPU” only helps when the dominant wait event changes.
Where IBEE fits, and where it doesn’t
If your bottleneck is storage I/O latency or log flush performance, the storage layer is part of the solution. If your bottleneck is lock contention or a bad query plan, adding vCPU or changing storage won’t fix the root cause.
So treat infrastructure changes as targeted. On IBEE, Block Storage gives you a defined IOPS and throughput envelope (backed by NVMe and DRBD replication). That’s useful when your wait events point to storage. But don’t confuse “we can provision better storage” with “we can fix your query.” Your database still needs correct indexing, sane transaction scopes, and stable memory behavior.
Optional: a second diagnostic chart you can build internally is a “wait type vs latency” plot. When you see the dominant wait type spike during slow periods, you stop guessing. You start fixing.
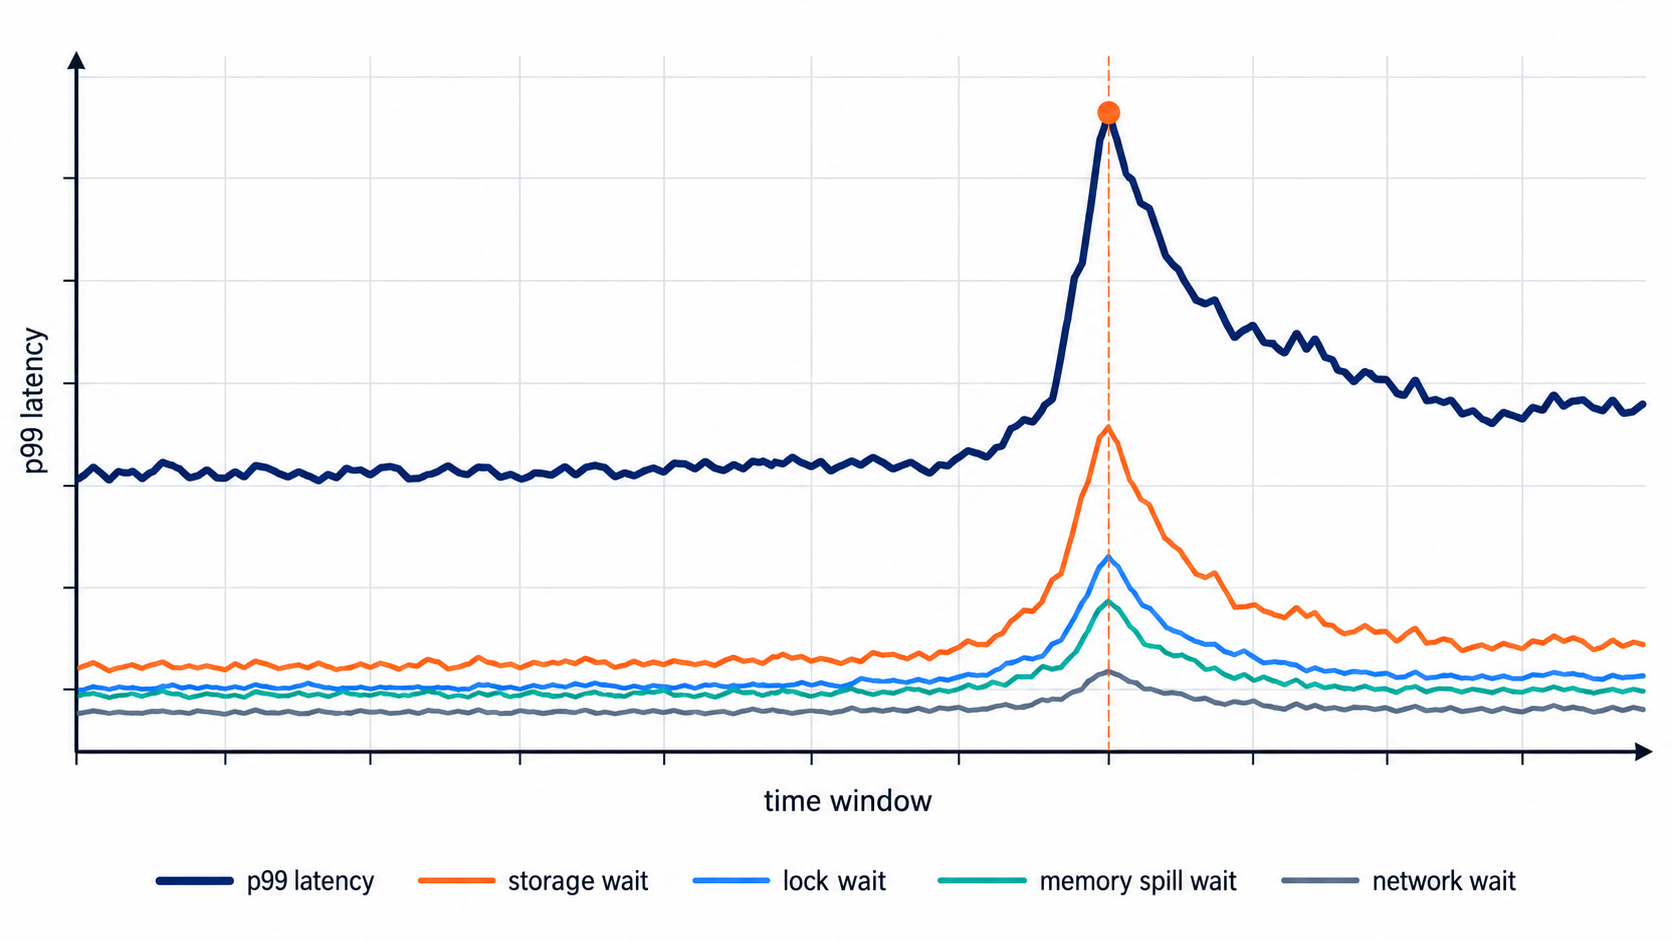
This helps you identify which wait type actually drives your p99 latency.
Do this today: prove the bottleneck in one hour
Pick one slow query (or one endpoint) that you can reproduce. Then do this exact action:
Run the vCPU change again only if you already captured “before” data. If you haven’t, stop and collect “before” now. Then collect wait events and p95/p99 latency for the same time window, and answer one question: did the dominant wait type change?
If it didn’t, you already know what to fix next. Move to the dominant wait category: storage I/O latency, memory spills, lock contention, network/replication delay, or the execution plan.