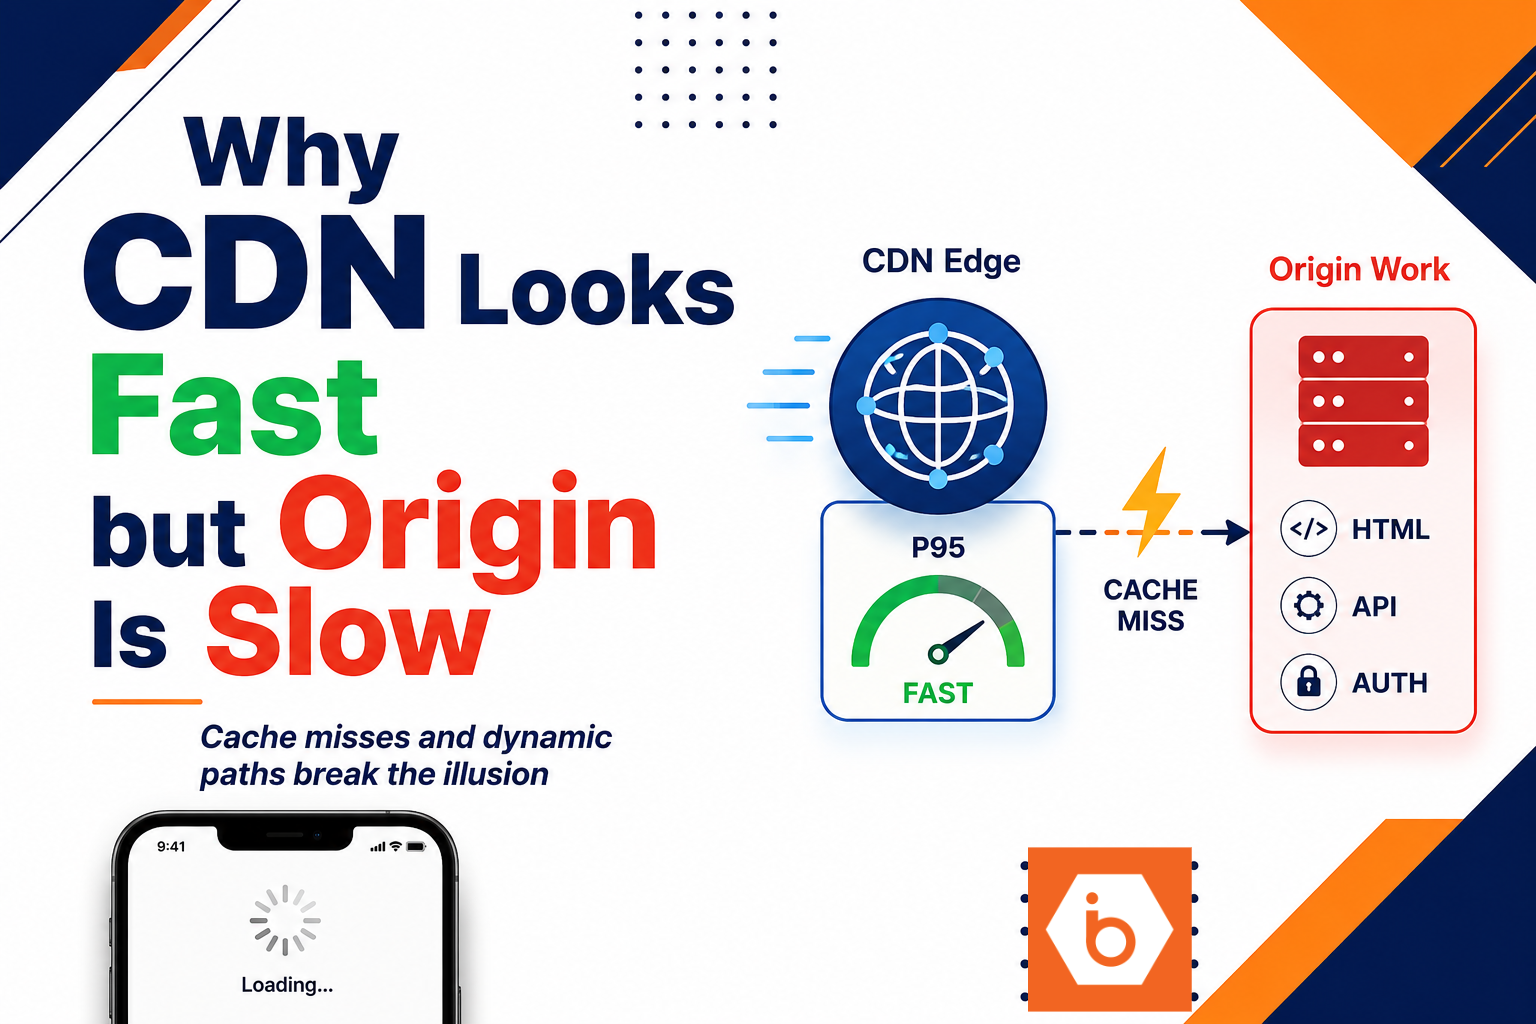

Your CDN looks amazing in dashboards. P95 at the edge is green. Then the same users start sending screenshots from their phones: “It’s still loading.” The uncomfortable truth is that you did not build a fast system. You built a fast illusion that collapses on cache misses and dynamic paths.
Most teams get this wrong in a very specific way: they optimize the CDN config, confirm cache headers on one static asset, and call it done. Meanwhile, their origin is quietly doing expensive work for the requests that actually matter: HTML, API responses, authenticated content, and anything with fragmented cache keys. When those requests miss the cache, your origin latency becomes user-perceived latency.
Let’s make this concrete. If your CDN hit rate is 90% but your remaining 10% are the slow endpoints that users hit during navigation, your “average” performance will lie to you. The users experience the tail. The CDN can’t hide the tail forever.
The mental model you need: CDN speed is a cache problem, not a network problem
A CDN can only be “fast” in two ways: it can serve from the edge cache, or it can make the trip to origin less painful than it would be directly from the user. Everything else is marketing.
Here’s the core chain:
- Client connects to the nearest CDN edge.
- CDN checks whether it has the object in the edge cache.
- If it has it, it responds immediately.
- If it does not, it fetches from origin, waits, then returns the response.
So when your origin is slow, you will only notice it for requests that do not get served from cache. That’s why you can see static images load quickly while your API or HTML endpoints crawl.
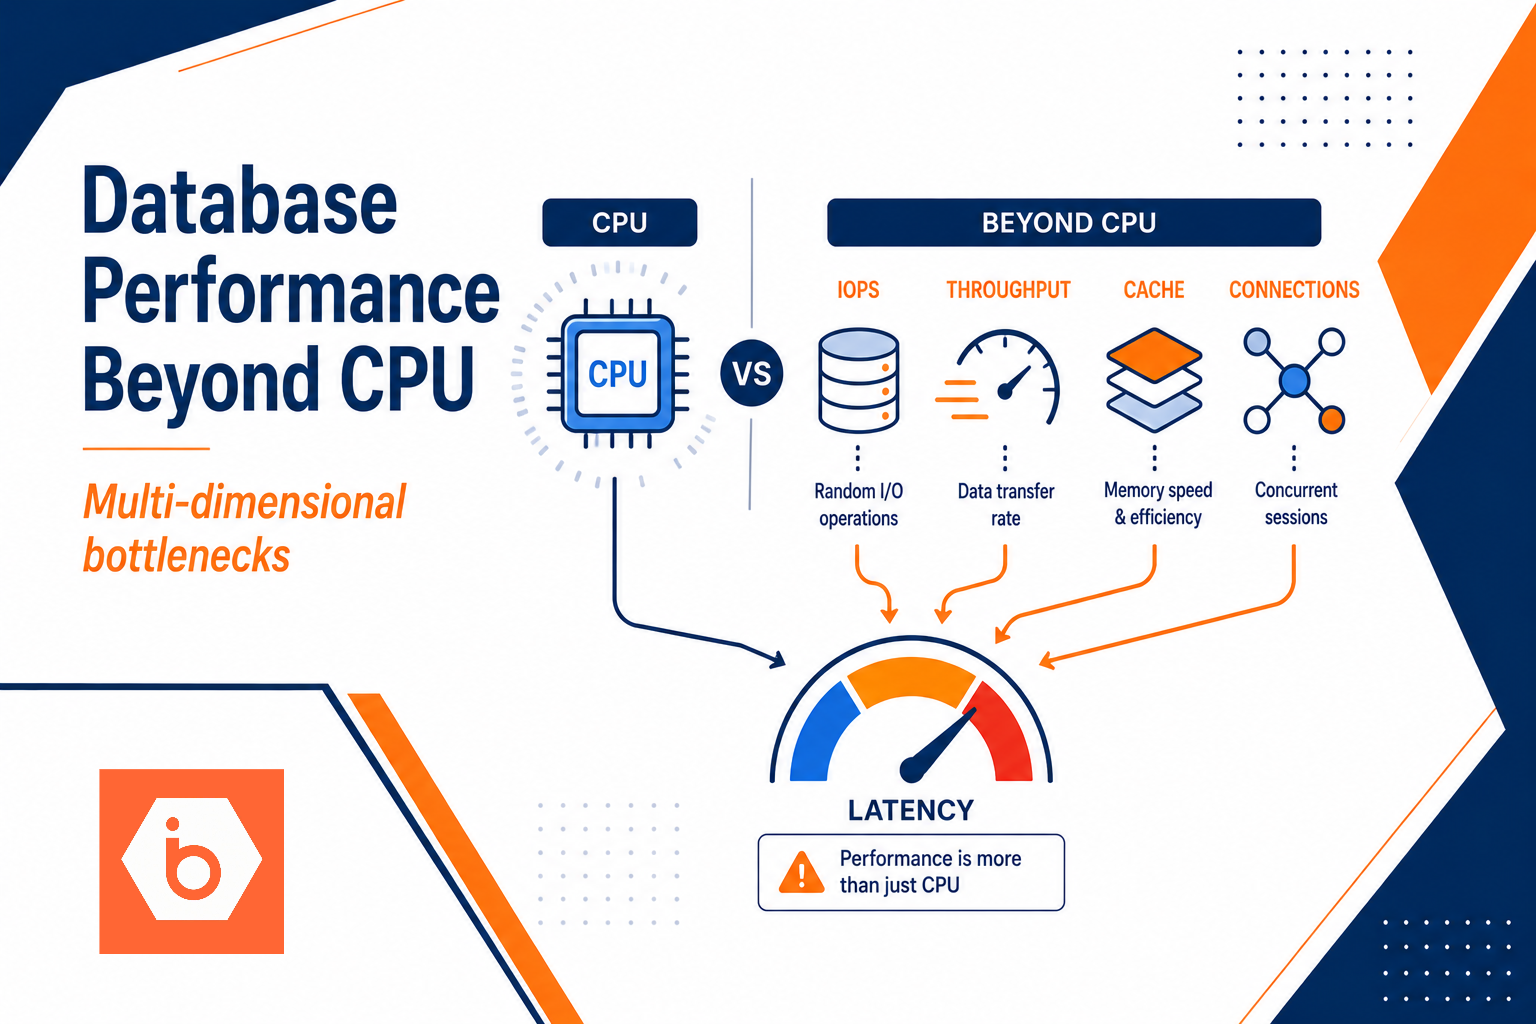
Also, “origin” in your setup is not one thing. It might be a VM running your app, a load balancer, a storage service, a Kubernetes ingress controller, and then a database behind that. The CDN only talks to the first hop it reaches. Your “origin latency” metric might be hiding a queueing problem inside your app or database.
The fix is not “buy a better CDN.” The fix is: prove which requests miss, why they miss, and what the origin does when it has to answer.
What to check first: prove which requests are slow and why they miss
Stop guessing. Start measuring the right signals.
You want to answer three questions for every slow endpoint:
- Is the CDN serving it from cache or fetching from origin?
- If it fetches from origin, what is the time breakdown: connection, TLS, origin fetch, and origin application time?
- What changed in cache behavior: cache-control headers, TTLs, query strings, cookies, auth, vary headers, or bypass rules?
Most teams look at “CDN overall latency” and miss the real story. CDN overall latency can look great while your cache miss path is catastrophically slow.
Cache misses are usually caused by config and headers, not by “traffic”
The usual culprits are boring and common:
- Cache-control set to no-store or no-cache for content you actually could cache.
- TTLs so short that the cache never stabilizes under real traffic.
- Cache keys that fragment because you include query strings, cookies, or auth headers inconsistently.
- Vary headers like Vary: Authorization or Vary: Cookie that force separate cache entries for each user.
- CDN rules that bypass caching for “safety,” often on broad path patterns like /api/* even when most of those responses are identical per user segment.
Most teams get this wrong at the worst time: after a release. They change an endpoint to include a new query parameter or a cookie, and suddenly cache keys explode. Your CDN hit rate drops. Origin sees a thundering herd. Everything looks like “origin got slower,” but it’s really “origin got asked more often.”
Dynamic requests are not automatically “uncacheable”
A lot of dynamic endpoints are only dynamic because you designed them that way. If your API response is deterministic for a user segment or for a short TTL, you can cache it safely.
Even with auth, you can often cache by token class, not by token value. Or you can split the response: cache the heavy parts, compute the personalized parts cheaply.
If you can’t cache the full response, you can still cache supporting assets used by the response, like reference data, feature flags, or expensive lookups.
Origin slowness can be queueing, not compute
When the CDN fetches from origin, the origin might be slow for reasons that have nothing to do with raw CPU time:
- Thread pool exhaustion and request queueing.
- Database lock contention or missing indexes.
- Connection limits to upstream services.
- Garbage collection pauses.
- TLS handshake delays if keep-alive is misconfigured between CDN and origin.
This is why you should treat origin latency like a system property, not a single number. Look at origin application timing and database timings together. If origin application time is low but time to first byte is high, you might be stuck in a network or queueing layer.
Required visual: how cache misses expose origin latency
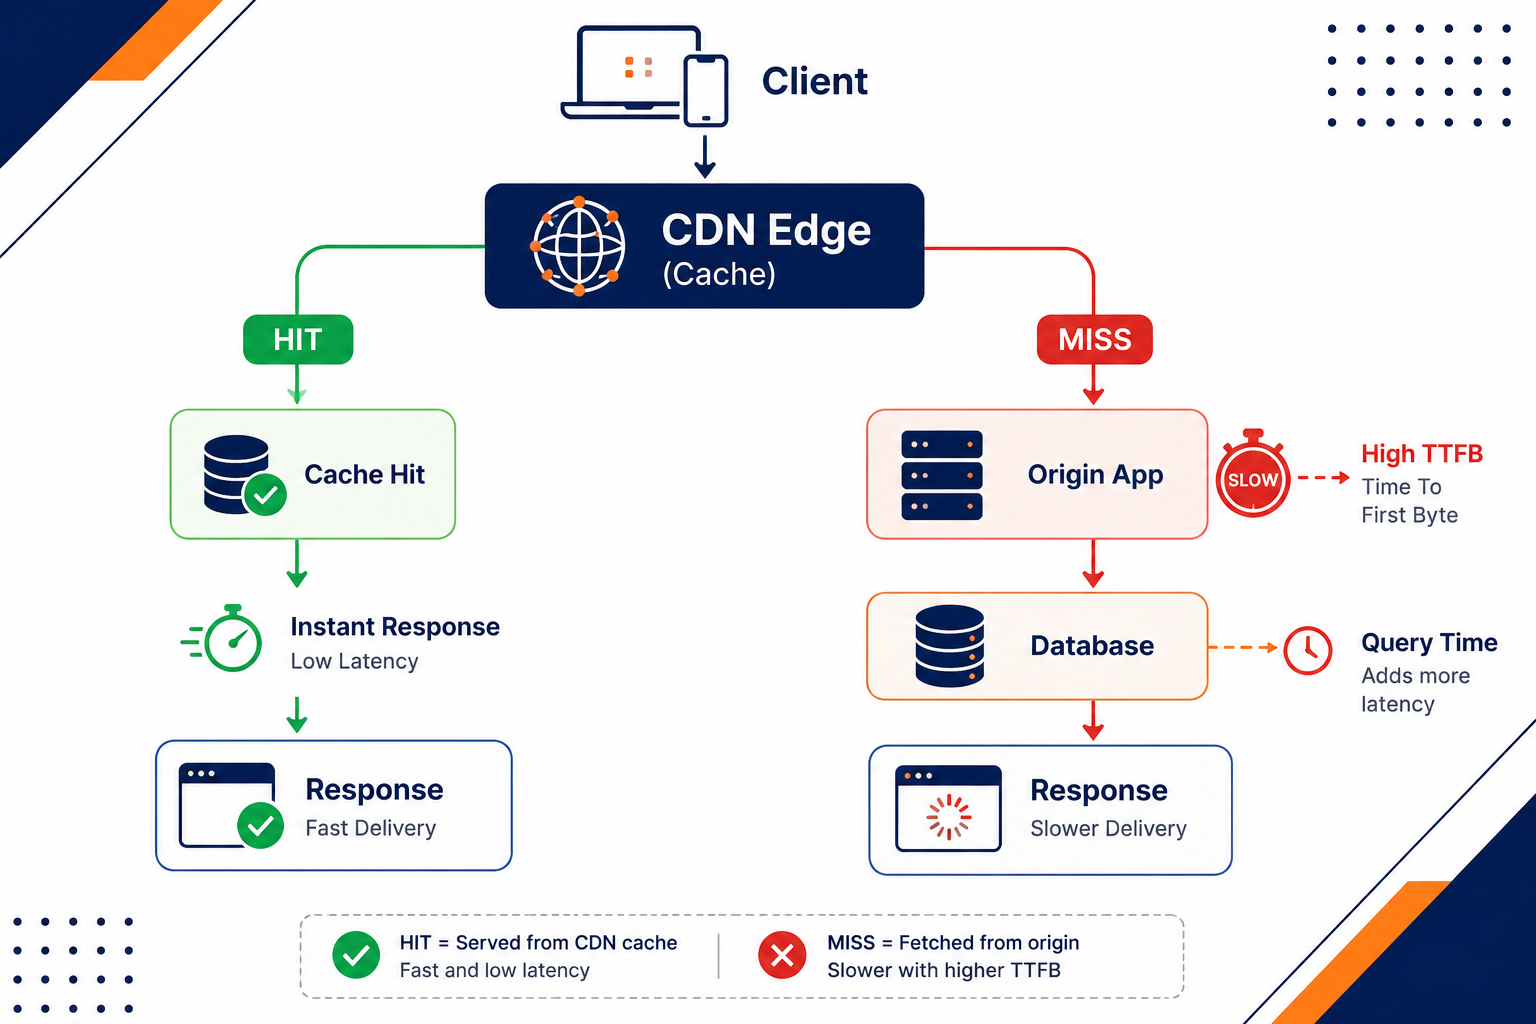
This shows how only cache misses force the CDN to wait on your origin.
The common failure modes: why “fast CDN” doesn’t mean “fast app”
Once you confirm what’s missing, you need to map it to the failure mode. Here are the ones that show up most often in real systems.
1) You cached the wrong thing
Teams often cache static assets and ignore the endpoints that dominate perceived performance: HTML and API calls during page transitions.
Your CDN can be perfect for /static/*.js and still feel broken if /api/cart, /api/search, or /feed are cache-miss heavy.
If you want a quick sanity check: take your slowest user journeys and trace the exact URLs that load during them. Then check cache hit rates per URL, not per domain.
2) Your cache key fragments and you accidentally disabled caching
Cache fragmentation looks like this: everything is “cacheable,” but the CDN has too many variants to reuse.
Common reasons:
- Query string included but not normalized.
- Cookies included in the cache key.
- Vary headers cause per-user variants.
- You set caching headers inconsistently between responses.
The result is that the CDN keeps going back to origin. The origin then becomes your bottleneck, even if it was fine before.
3) Your origin is slow only under CDN load
This is subtle. Your origin might perform well under direct traffic because your direct traffic pattern differs from CDN miss traffic.
Cache stampedes make this worse. When a popular object expires or gets purged, many CDN edges can request it at the same time. If your origin doesn’t have request coalescing, rate limits, or background refresh, it gets hammered.
This is why you should expect origin spikes right after deploys, cache purges, and TTL expirations. If you don’t plan for that, users experience the spike as “CDN is broken.”
4) Dynamic bypass rules route more traffic to origin than you think
CDNs often have “bypass cache” rules for safety: certain headers, certain paths, or certain status codes. One overly broad rule can turn 30% of your traffic into origin fetches.
Most teams get this wrong by copying a rule set from a blog post or previous vendor config. Then they forget to revisit it as their endpoints evolve.
5) TLS and connection reuse between CDN and origin are misconfigured
Even on cache misses, the CDN can still help. But only if the connection path is efficient.
If you see high origin fetch latency even for small objects, check:
- whether keep-alive is enabled between CDN and origin
- whether your origin supports modern HTTP versions
- whether certificates and handshake settings cause extra overhead
- whether the CDN and origin are in mismatched network regions
This won’t fix cache misses, but it can reduce the penalty when you do miss.
How to fix it without breaking correctness
You need to improve cache hit rate and reduce the cost of cache misses. Both are achievable, but you must be disciplined.
Step 1: pick a target endpoint set tied to user journeys
Don’t start with “everything.” Start with the top 10 URLs that dominate user latency.
For each endpoint, classify it:
- cacheable fully
- cacheable partially
- not cacheable (and then you optimize origin)
Step 2: make caching behavior deterministic
Ensure your responses set consistent Cache-Control and validation headers. Decide explicitly:
- TTL for cacheable content
- whether you use revalidation (ETag / Last-Modified) versus hard expiration
- which headers must be part of the cache key, and which must not
If you use Vary, treat it like a multiplier. Each extra dimension explodes the cache.
Step 3: prevent stampedes on popular objects
You have two practical approaches:
- Reduce expiration synchronized events by adding jitter to TTLs.
- Implement origin-side request coalescing so only one request recomputes while others wait.
If you can’t change origin logic quickly, you can at least avoid mass purges and use safer rollouts that don’t invalidate everything at once.
Step 4: for dynamic endpoints, cache the heavy parts
Split your responses. If 80% of the payload comes from expensive calls, cache that portion. Then personalize cheaply.
This keeps correctness while reducing origin work on the miss path.
Step 5: measure origin time breakdown on cache misses
On cache misses, collect:
- origin queue time
- application processing time
- database time
- upstream dependency time
Then fix the biggest component. If your origin is queueing, scaling compute won’t help until you also fix concurrency limits and backpressure.
If you run Kubernetes behind your ingress, pay attention to pod readiness, autoscaling lag, and connection handling. A “healthy” deployment can still queue requests if your autoscaler doesn’t react fast enough to miss spikes.
Optional visual: a simple decision flow for what to fix next
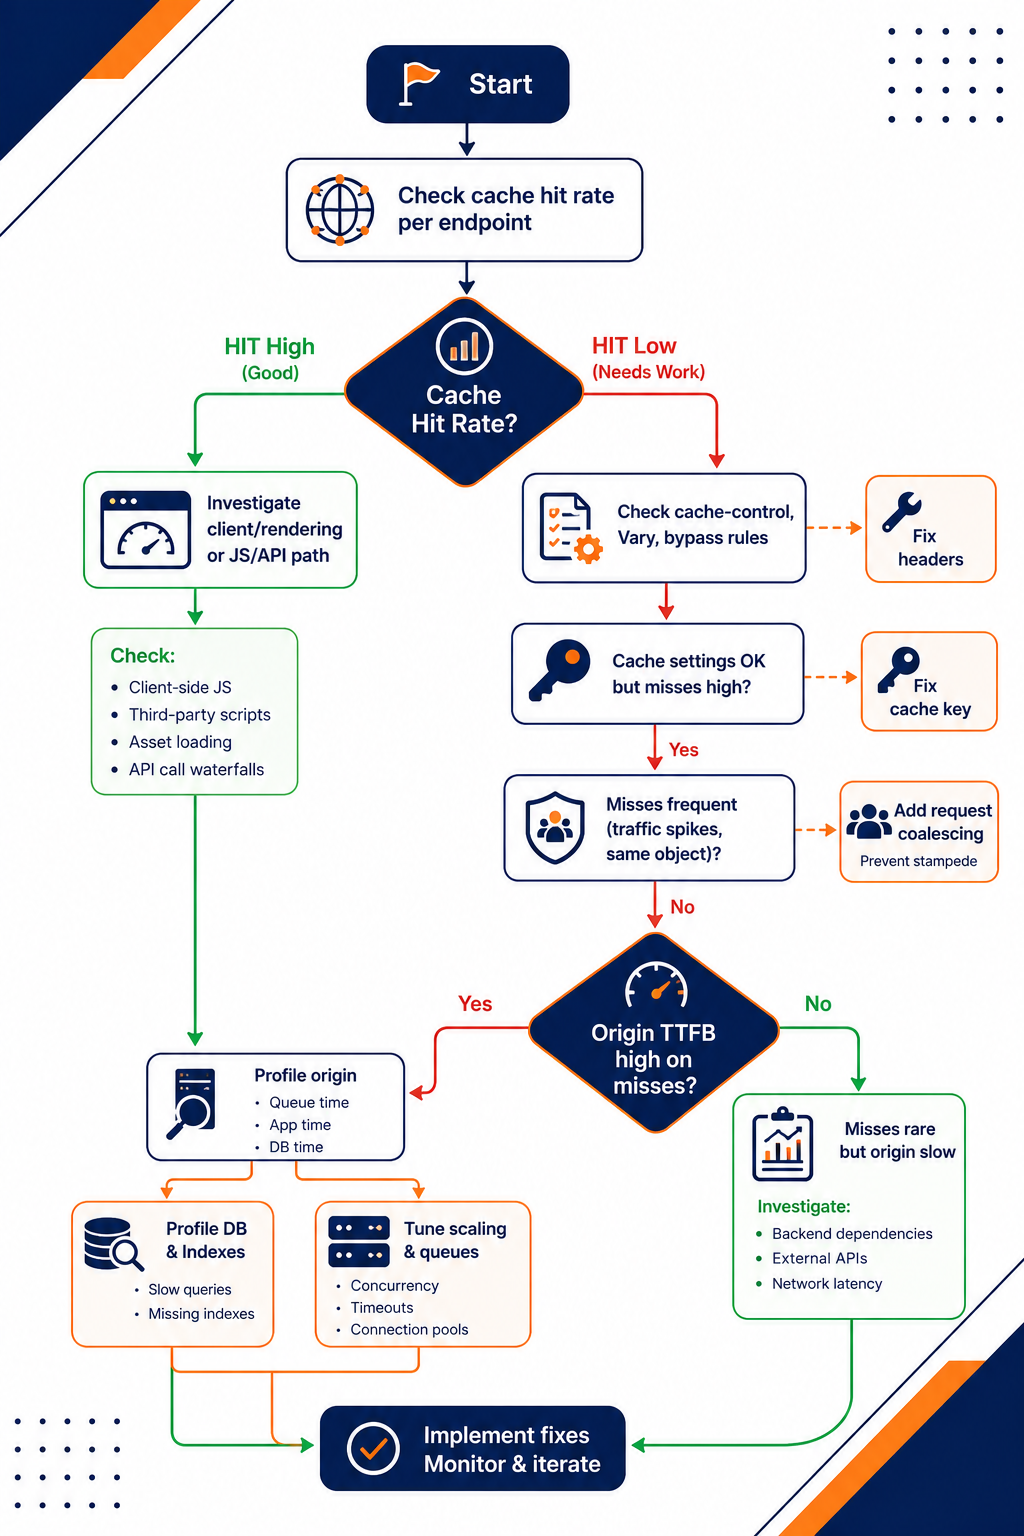
This helps you decide whether to tune caching or to optimize origin.
One concrete action you can take today
Pick one user journey that feels slow. List the top 10 URLs it calls. Then, for those URLs, pull two metrics: CDN cache hit rate and origin response time specifically on cache misses.
If cache hit rate is low for the slow URLs, fix caching headers and cache key fragmentation first. If hit rate is high but origin response time on misses is still high, profile your origin for queueing and database time, not just CPU.
Do that once, and you’ll stop arguing with dashboards. You’ll know exactly whether the problem is your cache, your bypass rules, or your origin under miss load.