
Most teams debug database slowness the same way: they look at CPU, see it is not pegged, and conclude “storage must be fine.” Then they add more instances, more threads, and more traffic. Latency gets worse. Throughput flatlines. The root cause was always the same: your workload hit a storage or cache limit, and concurrency turned that limit into queueing.
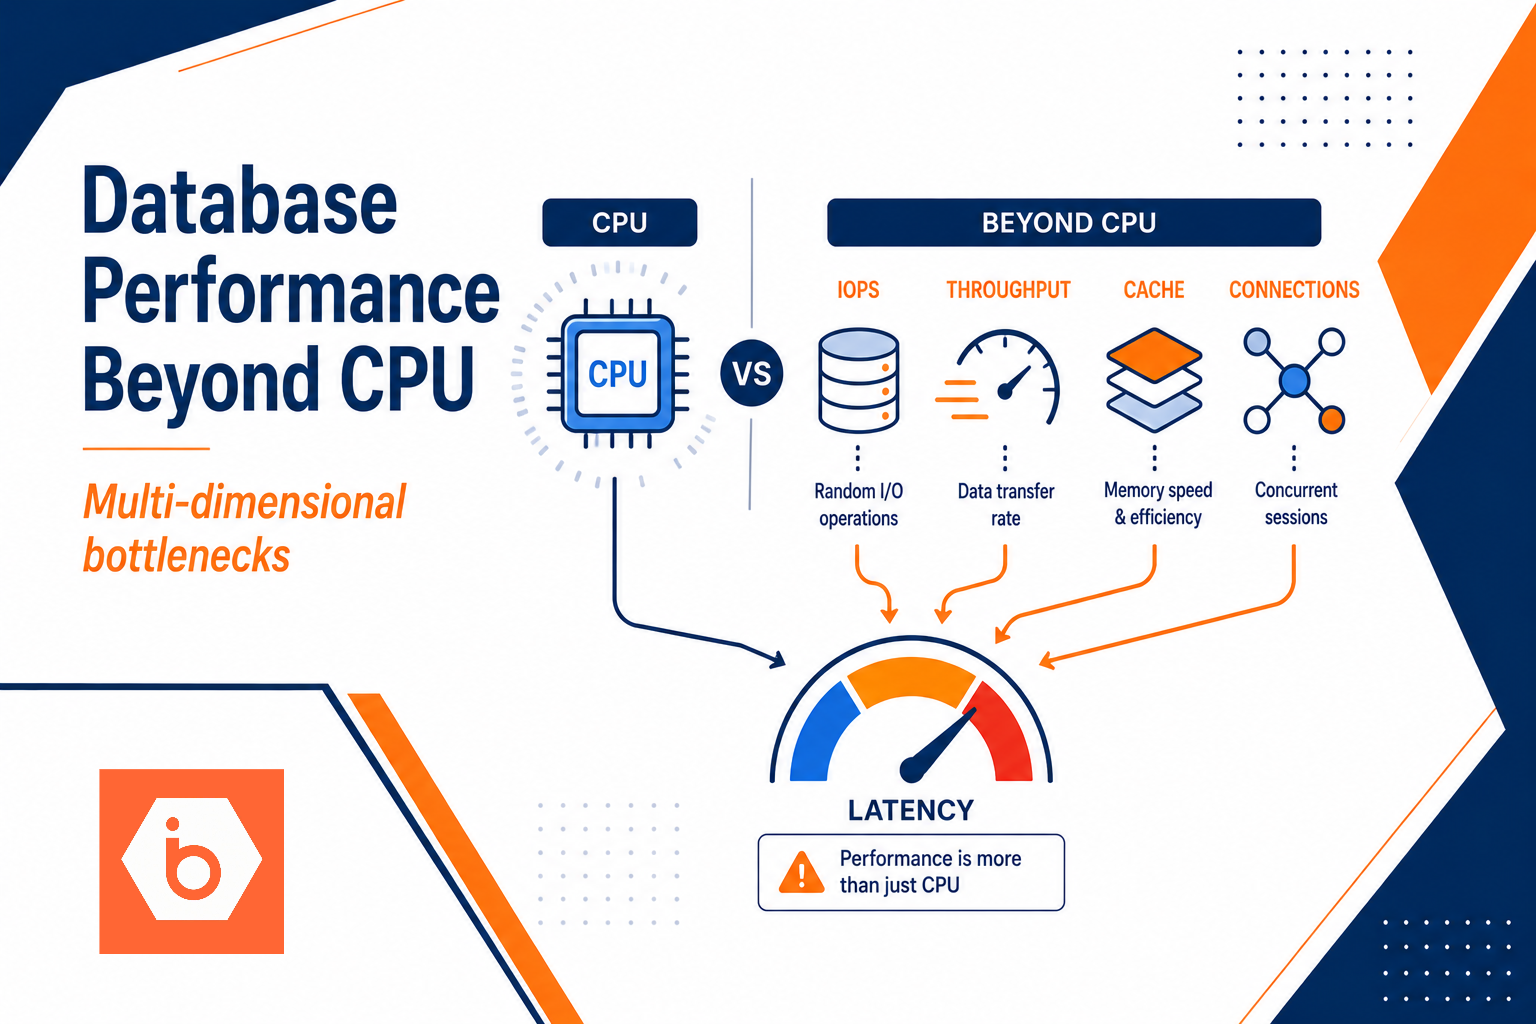
Here is the uncomfortable truth: database performance is multi-dimensional. CPU is one dimension. IOPS, throughput, cache hit rate, and connection concurrency decide whether your queries finish in 5 ms or 500 ms.
The failure pattern: CPU looks fine while users suffer
You can spot this pattern quickly in production.
You deploy or scale up. Response time rises. CPU stays flat. Threads pile up. You check “disk usage” or “IO wait” and it looks low or confusing. Meanwhile the database is stuck waiting on small random reads or log durability steps. That waiting shows up as queueing and tail latency, not as CPU saturation.
Most teams get this wrong in a very specific way: they treat storage as a single number. They look at “throughput” or total disk bandwidth and ignore IOPS and latency. Or they size memory and assume “more cache equals faster,” without checking whether the working set actually fits. Or they crank connection counts because “we have more users now,” and they never measure queue depth or outstanding I/O.
The database does not care what you feel about CPU graphs. It cares about waiting time.
Storage performance: IOPS, throughput, and why latency dominates
Storage has three knobs that matter to databases: IOPS, throughput, and latency. You can have high throughput and still be slow if your workload is random and latency spikes under concurrency.
- IOPS limits you when your workload issues lots of small reads or writes. Think index lookups, fetching rows by primary key, and updating secondary indexes. This is the classic OLTP pattern.
- Throughput limits you when you stream large amounts of data. Think scans, bulk loads, ETL, and backups.
- Latency is what your users feel. For random I/O, a few milliseconds extra becomes hundreds of milliseconds at the query level once you multiply by round trips, locks, and retries.
Here is the trap: IOPS and throughput compete for the same finite internal resources. When you push for more IOPS, you often reduce the sustained throughput you can achieve. When you push for more throughput, you can increase latency for random operations. The database turns those trade-offs into query delays.
Also, storage behavior changes with queue depth. Most storage stacks use internal scheduling. If your database issues more concurrent I/O than the storage can efficiently service, latency rises sharply. That is why CPU can stay low. The workers are blocked waiting for I/O completion.
Practical rule: if your p95 or p99 latency worsens while CPU stays flat, assume you are hitting storage latency or cache misses, not “slow compute.”
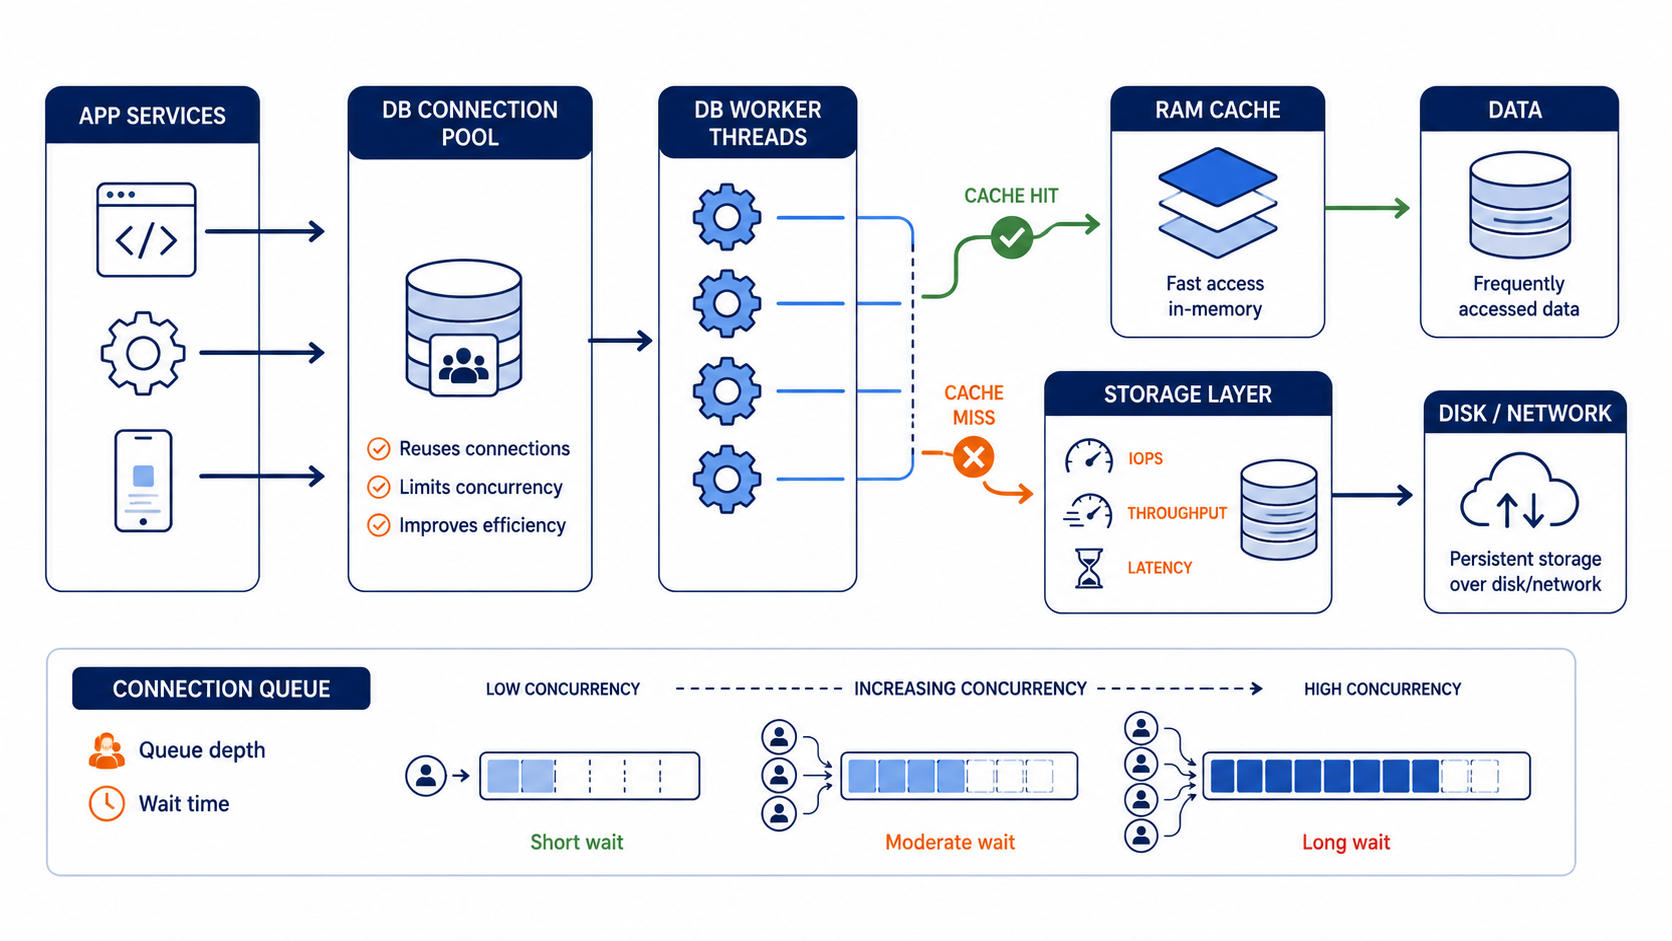
This shows how cache hits, storage latency, and connection queueing combine to create slow queries
Cache: the cheapest “storage” you already paid for
Cache is where performance goes to die quietly.
Databases usually have multiple cache layers: OS page cache, database buffer cache, and sometimes plan or metadata caches. The OS cache can help if your I/O pattern is stable. The database cache matters because it decides whether your next query reuses the same pages, index blocks, and metadata structures.
The key metric is not “RAM size.” It is effective cache hit ratio and whether your working set fits. If your working set does not fit, every cache miss becomes an I/O wait, and those waits become queueing under concurrency. That is how you get the same story as the CPU graph: low CPU, high latency.
Most teams get this wrong when they “fix” cache by adding memory without validating the working set. They also get it wrong when they assume sequential scans are fine on a cache-limited system. Sequential scans can evict hot index pages and turn subsequent OLTP queries into random I/O misses.
So what should you measure? Track hit ratio and page faults (or equivalent DB-level indicators), then correlate with query latency. If cache misses rise during the same window your p95 latency rises, stop debating CPU.
Trade-off you must accept: more memory can help until you hit diminishing returns and other bottlenecks take over, like locks, connection queueing, or CPU for query execution. But if cache misses are high, adding CPU does not fix the problem. It just schedules more blocked workers.
Connections and concurrency: the hidden multiplier
Connections are not the same as concurrency. You can have many connections sitting idle, and you can have fewer connections producing high concurrency through async operations or parallel query execution. The database cares about how many active operations are competing for resources.
When concurrency rises, two things happen:
First, you increase demand on storage. Even if average load is fine, spikes create a queue. Queueing turns small latency into tail latency. That tail latency is what breaks user experience.
Second, you increase contention. Locks, latches, and internal worker scheduling all get worse when you run more operations than the system can service efficiently. That can keep CPU low because workers block on locks or I/O completion. It feels like “not compute bound,” but the wait is still the bottleneck.
Use a simple mental model: if you increase outstanding work without increasing capacity, waiting time rises. That is true for I/O, locks, and CPU scheduling.
A concrete symptom set:
- p95 and p99 latency climb faster than average latency.
- CPU stays flat.
- Active sessions increase.
- Storage latency and queue depth increase (or show up indirectly as slower I/O completion).
If this matches your incident, you do not need more connections. You need fewer concurrent operations per critical path and better backpressure.
Throughput vs IOPS: you need the right storage shape
People love to compare storage by a single number. Don’t.
Your database workload dictates whether you need IOPS headroom, throughput headroom, or both. OLTP systems often need enough IOPS and low latency to handle random index and page reads and writes. Analytical workloads often need sustained throughput and large sequential transfers.
This is where storage “shape” matters. For example, an NVMe-backed block storage system with high shared IOPS and controlled throughput can behave very differently from a system that looks similar on paper but has higher latency under mixed random and write patterns.
If you run a Kubernetes platform, you also need to remember the operational reality: your database nodes are not isolated islands. Connection pools, load balancers, and app retry behavior can amplify concurrency spikes. Your platform controls how quickly new requests hit the database. That means your DevOps choices directly affect database performance.
At IBEE, we build block storage on a 3-node LINSTOR cluster with DRBD 2-replica redundancy, and the storage nodes run on dedicated high-speed networking. That kind of design matters when your database is issuing lots of concurrent I/O and you need consistent latency, not just peak throughput. (Yes, this is still the same IOPS and latency story.)
How to diagnose in 30 minutes without guessing
You do not need a week-long performance project. You need disciplined observation.
- Pick one time window where latency spiked (p95 or p99). Freeze the metrics for that window.
- Check CPU, but treat it as a “not the answer” signal if it stays flat.
- Look for cache indicators: hit ratio down, page faults up, or equivalent DB cache miss metrics up.
- Check storage indicators: I/O latency up, queue depth up, or “slow I/O completion” signs.
- Check concurrency: active sessions and in-flight requests up, thread pool saturation, connection pool exhaustion.
- Correlate: do cache misses and storage latency move together? Do p99 spikes align with concurrency spikes?
If you get cache misses plus storage latency, you have an IOPS/latency problem, not a CPU problem. If you get lock contention plus rising concurrency, you have a concurrency control problem. If you get neither, you may have query execution issues, but you only go there after you rule out waiting.
Optional but useful: temporarily reduce concurrency at the application or connection pool layer and see if p99 drops. If it does, you just proved queueing is the bottleneck.
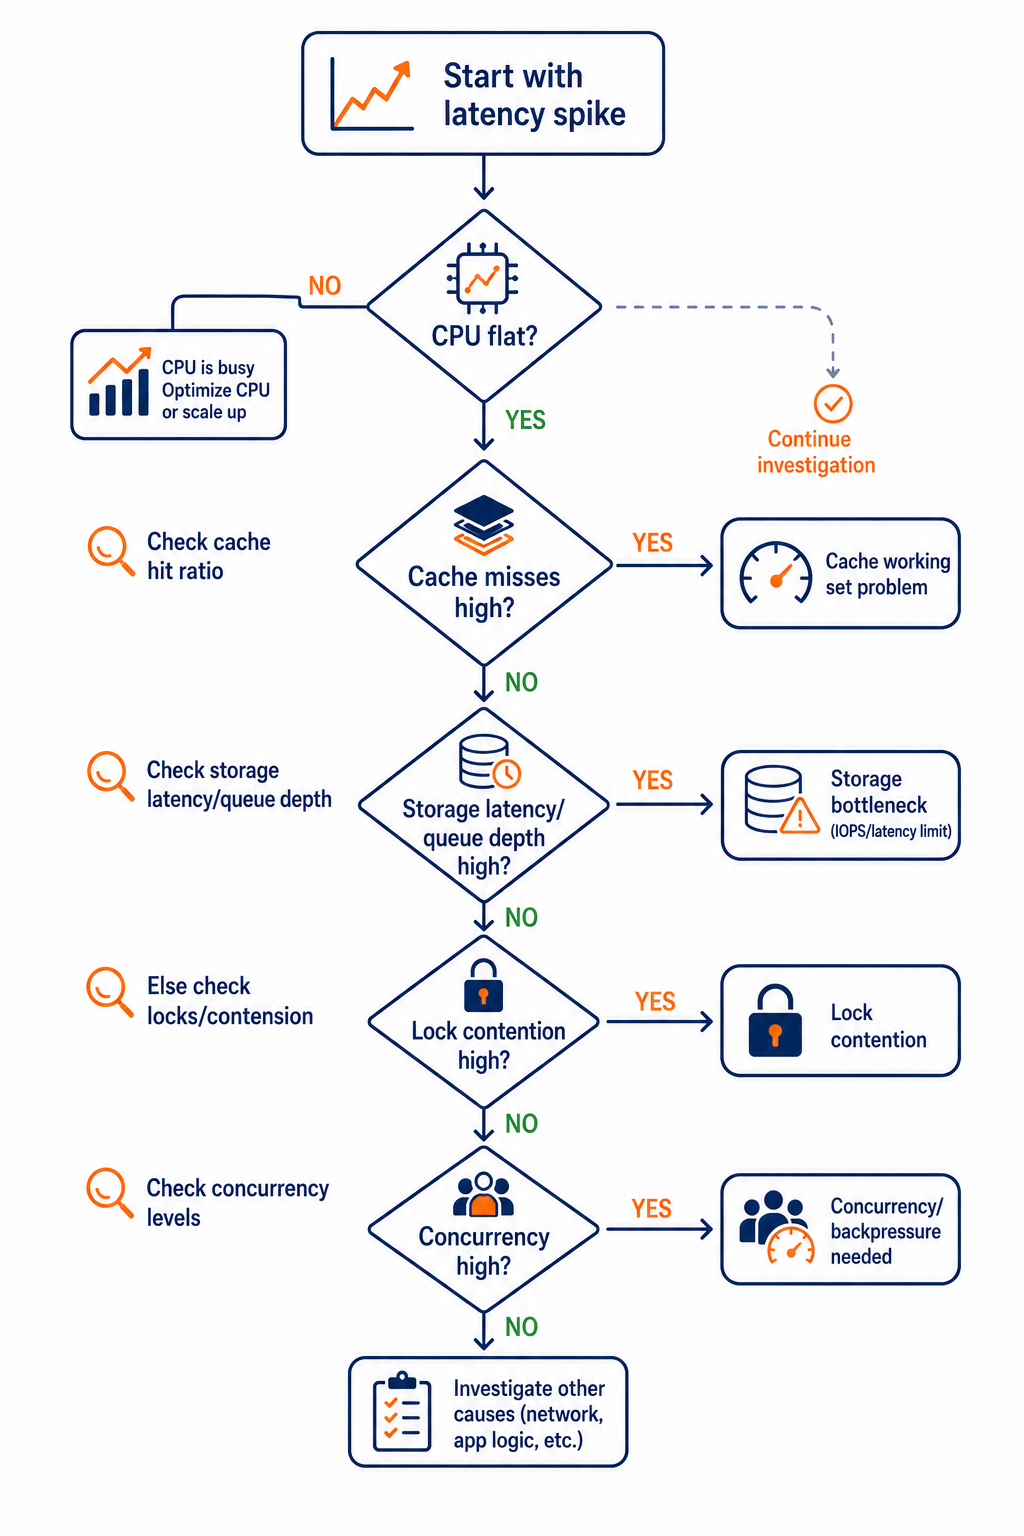
This decision flow helps you narrow the bottleneck fast during a latency incident
One concrete action you can take today
Stop treating “more capacity” as your default fix.
Today, enforce backpressure and cap concurrency at the app or connection pool level, then set an alert on p99 latency alongside cache miss rate (or page faults) and storage latency/queue depth. If p99 drops immediately when you cap concurrency, you have your answer: your database was waiting, and your system amplified it with too much parallel work.
If you want, tell me your database type and workload pattern (OLTP vs mixed vs analytics), and I’ll suggest what exact metrics to pull and what thresholds usually indicate IOPS limits versus cache misses versus connection queueing.