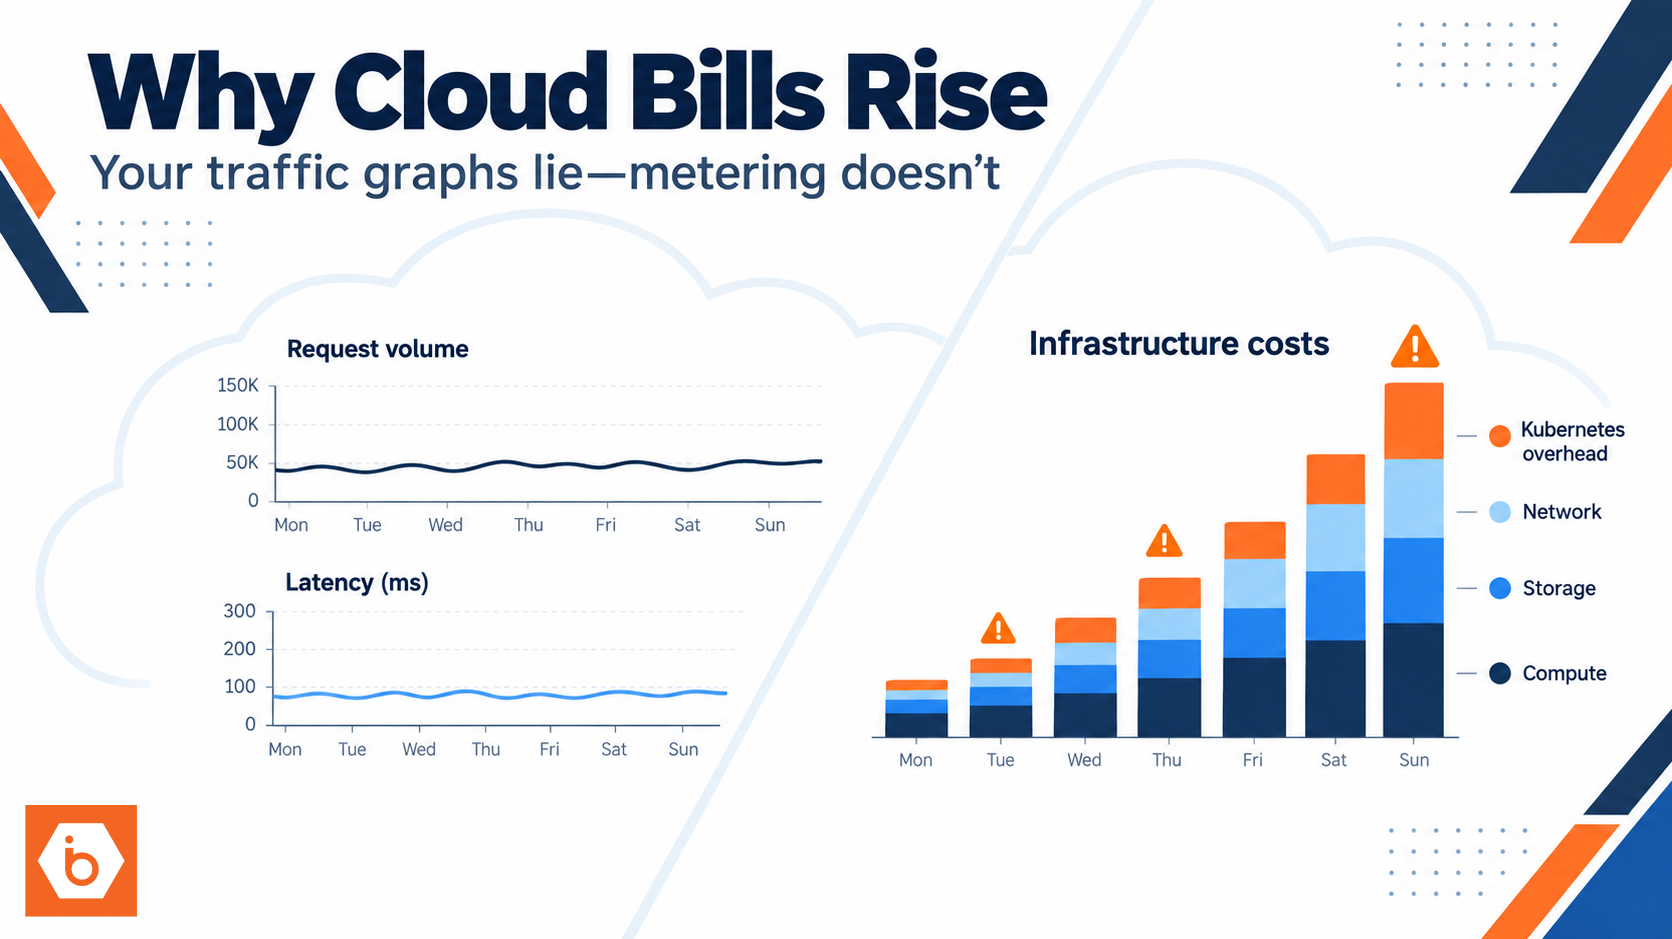

Most teams don’t wake up and decide to spend more on logging. It happens quietly. You add a few services. You enable structured logging. You turn on DEBUG for “just the one incident.” Then your log bill starts climbing while your VM and storage spend looks flat.
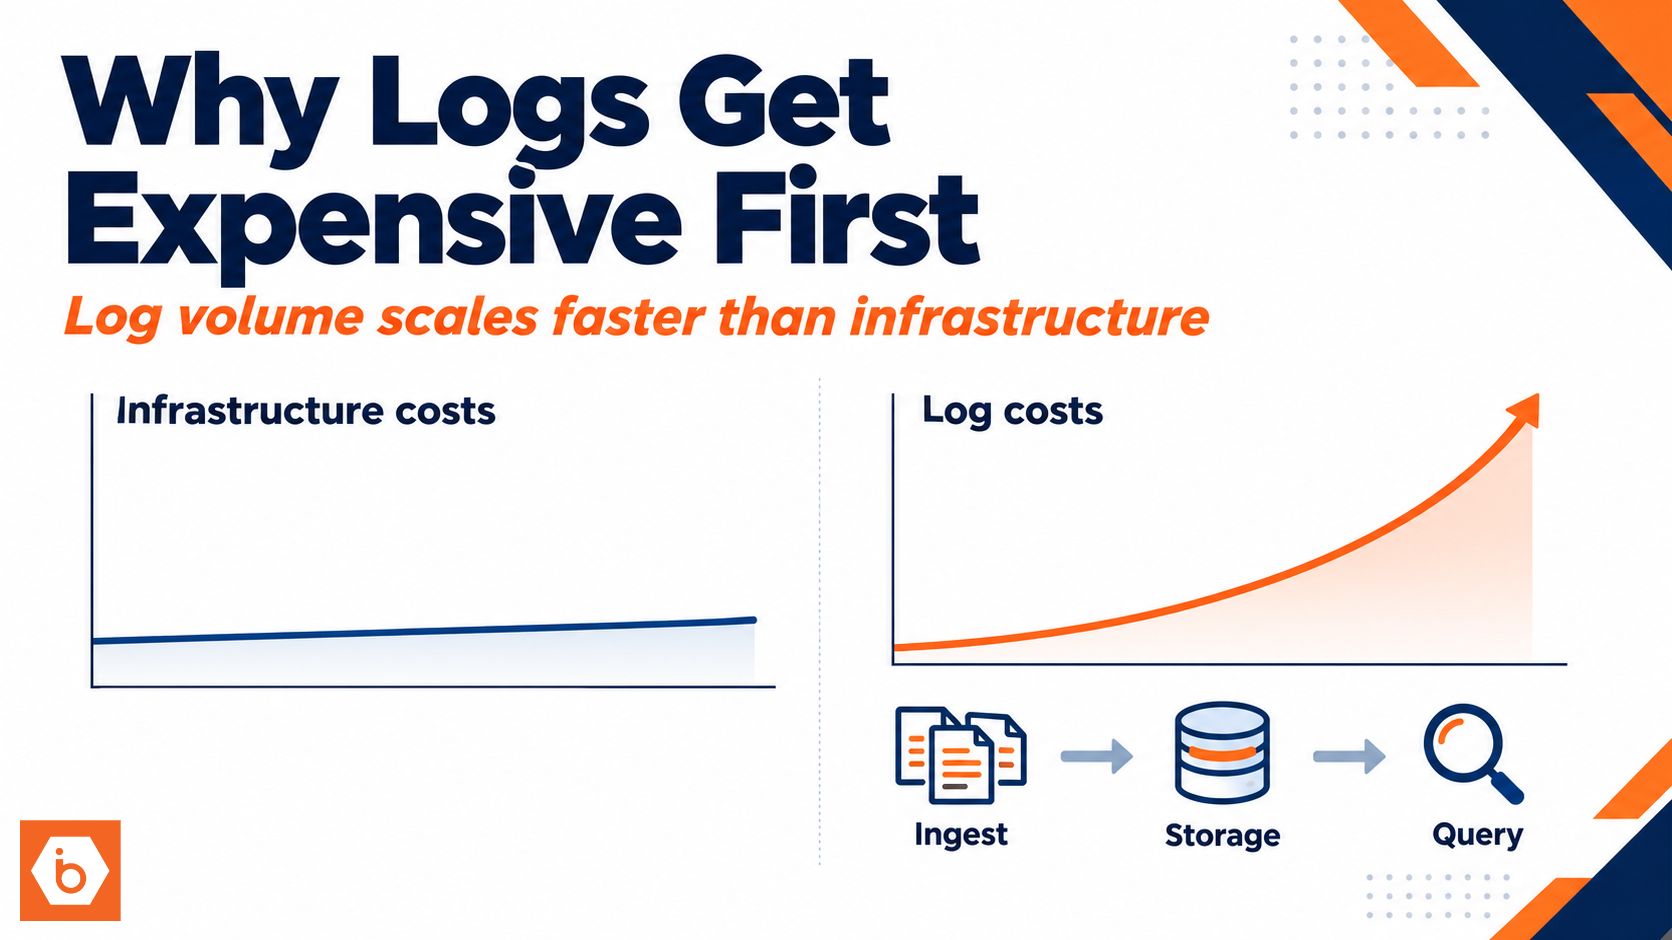
The uncomfortable truth: you usually pick your logging strategy based on developer convenience, not on how costs scale with volume, retention, and access patterns. Infrastructure costs can plateau. Log costs rarely do.
The log pipeline is a cost amplifier, not a passive recorder
Your logs travel through a pipeline. Every stage can multiply cost, and some stages amplify each other.
A typical flow looks like this: your application emits events, agents collect them, a central system ingests and parses them, it indexes what you want to search, it stores raw or processed copies, then teams query them during incidents and investigations. Each step has a different pricing model, so “we barely changed traffic” does not mean “we barely changed cost.”
Here is the key mental model: infrastructure scales with load. Logging scales with load times your logging policy, plus your incident behavior, plus your indexing and retention choices. That can turn linear traffic growth into superlinear log growth.
Most teams get this wrong at the beginning: they log “everything” with rich payloads and high-cardinality fields, then they keep it for longer than they need because “we might need it later.” That later comes sooner than you think.
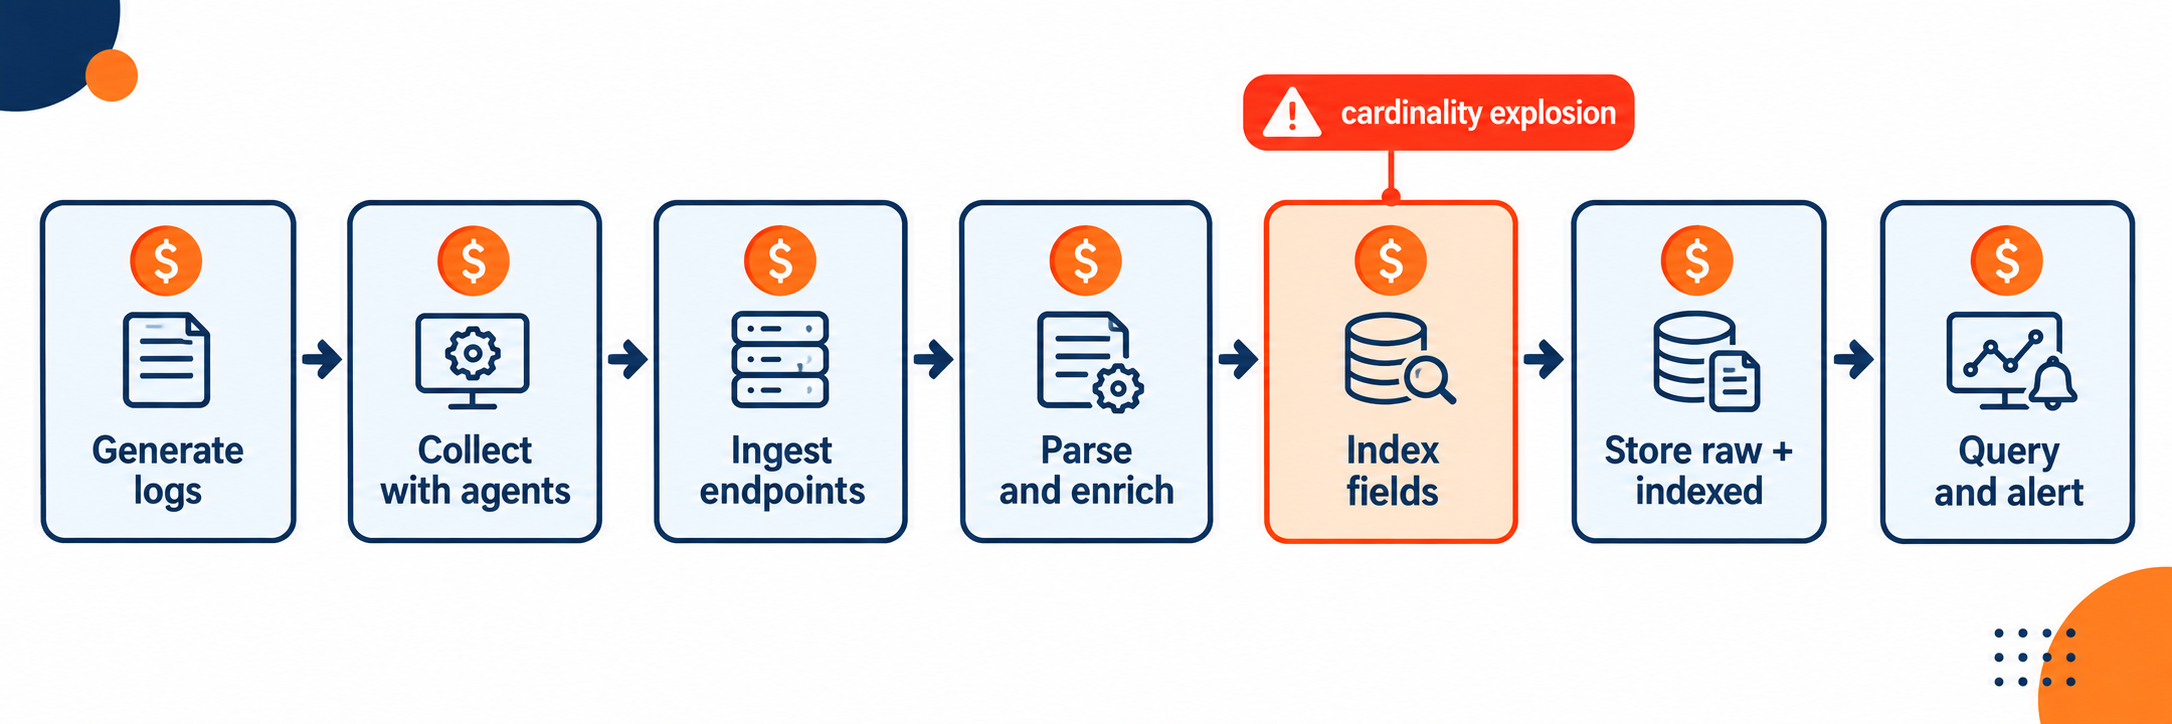
Shows how log generation, ingestion, parsing, indexing, storage, and querying each add cost.
Why logs get expensive before your infrastructure does
Infrastructure spend has knobs that stabilize it: autoscaling, right-sizing, caching, batching, and storage lifecycle controls. Logs have knobs too, but most teams touch the wrong ones first.
1) Logs are write-amplified by design
You don’t just write one log per request. You often write multiple. Your app logs once, your gateway logs again, your auth layer logs again, your database driver logs slow queries, your retry logic logs failures per attempt, and your circuit breaker logs on every transition.
During normal operation, that might be tolerable. During partial failures, it gets brutal. Retries spike. Timeouts spike. Error rates spike. Then you also enable more verbose logging, because humans do what humans do.
One incident can create days of downstream cost because the pipeline queues, buffers, and then backfills.
2) Retention increases linearly, but indexing can grow faster
Raw storage grows roughly linearly with retention. Indexing does not. If you index more fields, or you index fields with high cardinality, your index data grows disproportionately.
High-cardinality fields are the silent killer: user_id, session_id, request_id, trace_id, email addresses, IPs. You might think “we need to search by user.” You do. But if you index every such field forever, you are paying for it every time you query and every time you maintain indexes.
3) Parsing and enrichment can be the hidden tax
Many platforms charge for ingestion and also for what happens after ingestion. Grok and regex extraction, JSON normalization, geo-IP and user-agent parsing, and correlation between trace IDs and log lines all add compute.
Even if the platform bills you “per GB ingested,” your pipeline can still become more expensive because enrichment increases message size and complexity. Bigger messages mean more bytes, more parsing work, more indexing work.
4) Query patterns turn “storage” into “compute”
Teams tend to query logs like they query dashboards: lots of ad hoc searches, broad time ranges, and repeated investigations. If your queries scan large time windows or you run full-text searches across high-volume fields, cost moves from storage into compute.
Also, concurrency matters. A single incident can trigger dozens of parallel investigations from different dashboards and alert drilldowns.
5) Duplication happens when you centralize “everything”
Centralization is good. Duplication is not. If you forward the same events multiple times, keep both raw and processed copies, and send logs into both a log analytics system and a SIEM, you pay multiple times for the same story.
This is where “we just added one more tool” becomes “we doubled the bill.”
The specific mistakes that trigger the bill jump
You can usually trace the first big jump to a small set of changes. If you don’t have a timeline, you will guess. Guessing wastes time. Here is what to check in order.
- Did you increase log level globally, even briefly? One DEBUG toggle can multiply volume by 5 to 20x depending on how your app logs.
- Did you start logging request and response bodies, stack traces, or large structured payloads?
- Did you add new fields with high cardinality and also index them?
- Did you extend retention “temporarily” for compliance or investigations?
- Did you add retries, bulk operations, or background jobs that emit logs per item?
Now the part most teams miss: they fix the symptom, not the scaling behavior. They reduce log level. They forget that queries are still running broad searches, and that indexing still includes the worst fields. Or they reduce retention for raw logs but keep indexed copies for the longer period.
Also, one real-world pattern: at a fast-growing SaaS company, the team “improved observability” by enabling structured logging with trace IDs and user IDs in every event, then they kept 180 days because leadership wanted auditability. Their VM spend stayed stable, but log indexing and query costs became the top line item within two quarters.
How to stop the bleeding without breaking debugging
You don’t need to turn logging into silence. You need to make logging predictable and bounded.
The fastest wins come from controlling what you log, what you index, and for how long. Treat logs like a product with an SLO: “we can search relevant events quickly, and we don’t bankrupt the company.”
First, decide what each log type is for. Application logs are not the same as audit logs. Debug logs are not the same as incident logs. If you mix them, you pay for the worst retention and the worst indexing for everything.
Second, enforce “log budgets” per service. Budgets force trade-offs early, when they are cheap. If a service exceeds its budget, you require a reason and a remediation plan. This is where platform engineering earns its keep.
Third, reduce cardinality in indexed fields. Keep high-cardinality fields in the raw payload, but only index what you truly query. If you need to find by user_id, consider indexing only for a limited retention window or using a separate lookup strategy.
Fourth, make incident logging intentional. Don’t enable DEBUG everywhere. Enable it for a narrow scope: one service, one environment, one time window, and ideally one tenant or one trace. And make sure it auto-expires.
Finally, change query habits. Encourage time-bounded searches and avoid “search everything” dashboards. If your team needs frequent aggregations, precompute them during ingestion or use a dedicated analytics pipeline rather than hammering raw logs.
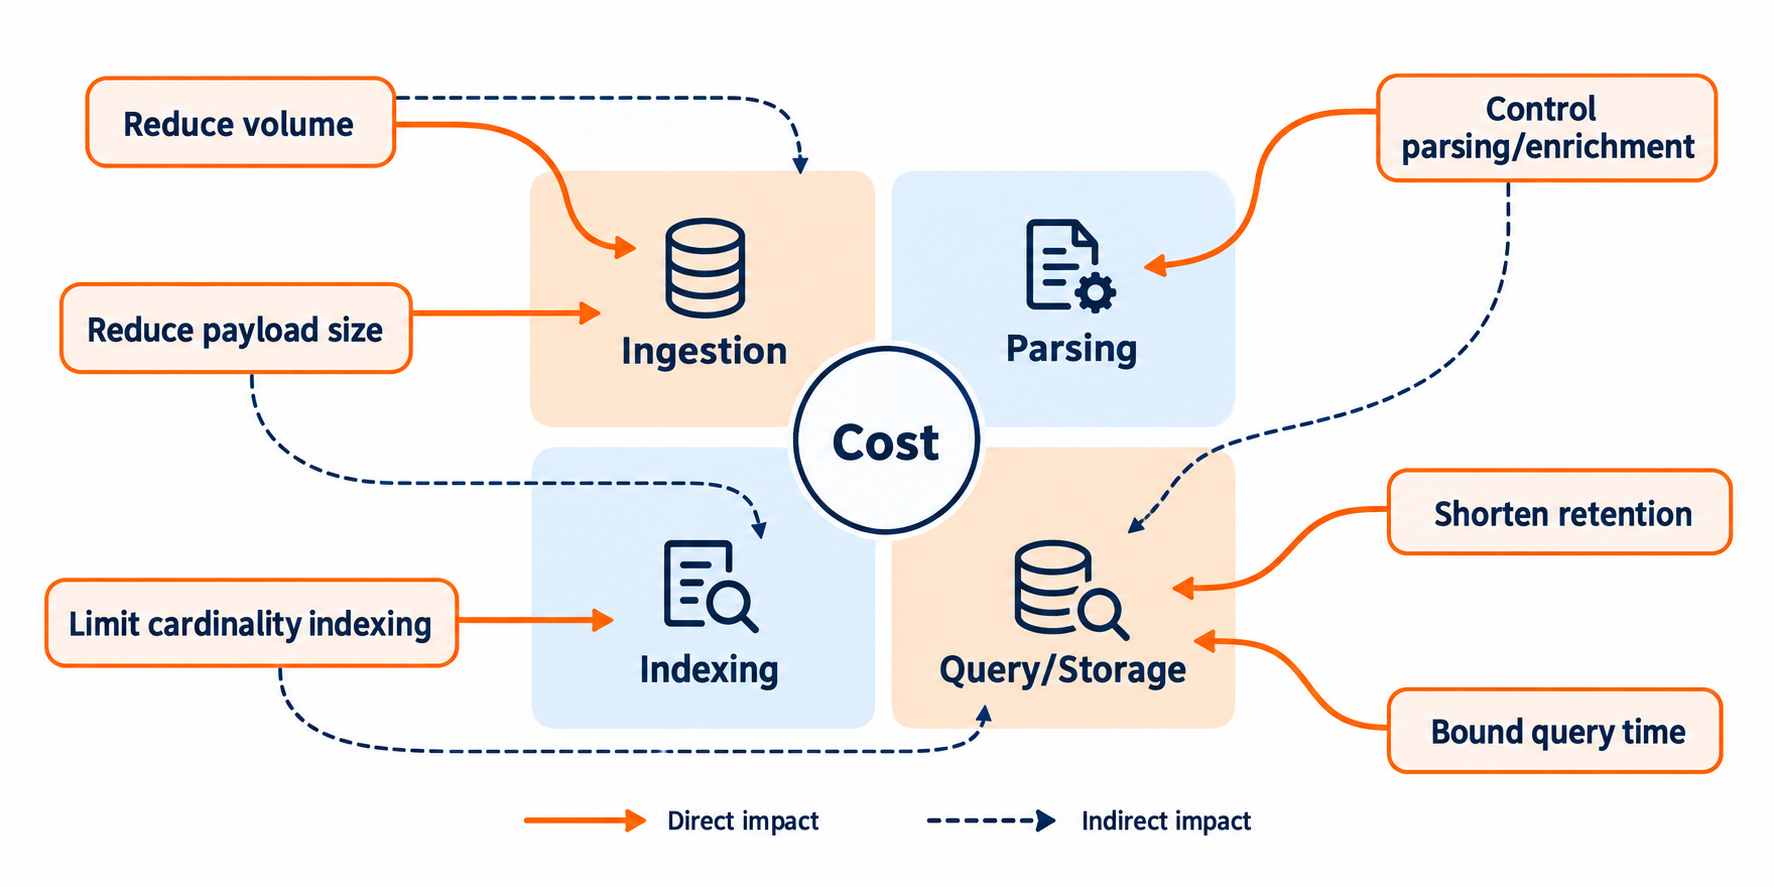
Connects common logging controls to the specific cost center they reduce.
A concrete action you can take today
Pick one service and do a 30-minute cost audit. Export the top 20 log event types by size and by ingestion rate for the last 7 days. Then do three edits immediately: cap the log level for that service in normal operation, remove or stop indexing the top 2 high-cardinality fields, and shorten retention for raw logs while keeping only what you need for search. After that, add a log budget alert so the next “harmless change” cannot silently turn into another bill spike.